Det Energipolitiske Udvalg 2009-10, Miljø- og Planlægningsudvalget 2009-10
EPU Alm.del Bilag 59, MPU Alm.del Bilag 123
Offentligt
World Energy Outlook 2009Copenhagen, 11 November 2009
� OECD/IEA - 2009
The contextThe worst economic slump since the 2ndWorld War & signs of
recovery –but how fast?An oil price collapse & then a rebound –rising marginal costs point to
higher prices in the longer term, but are current levels sustainable?A slump in energy investment due to the financial & economic crisis –
will it bounce back quickly enough to avert a supply squeeze later?Difficult negotiations on a post-2012 climate deal leading up to
Copenhagen– what is needed to avert catastrophic climate change?
� OECD/IEA - 2009
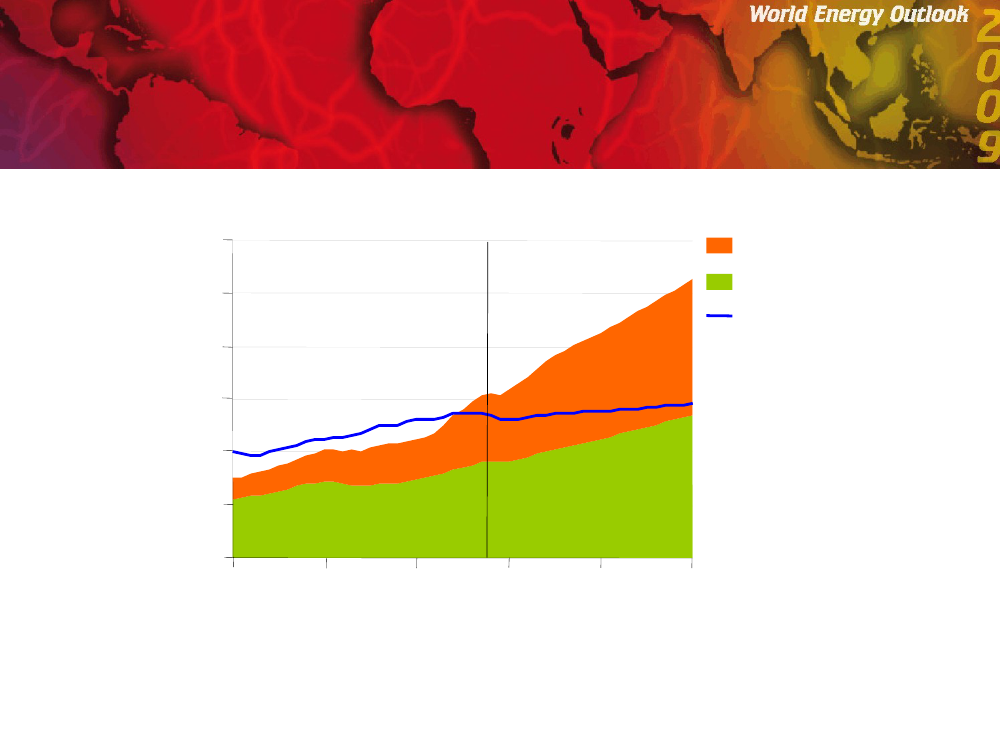
World primary energy demandin the Reference ScenarioMtoe12 00010 0008 0006 0004 0002 00001980China and IndiaRest of non-OECD
OECD
1990
2000
2010
2020
2030
Non-OECD countries account for 93% of the increase in global demandbetween 2007 & 2030, driven largely by China & India� OECD/IEA - 2009
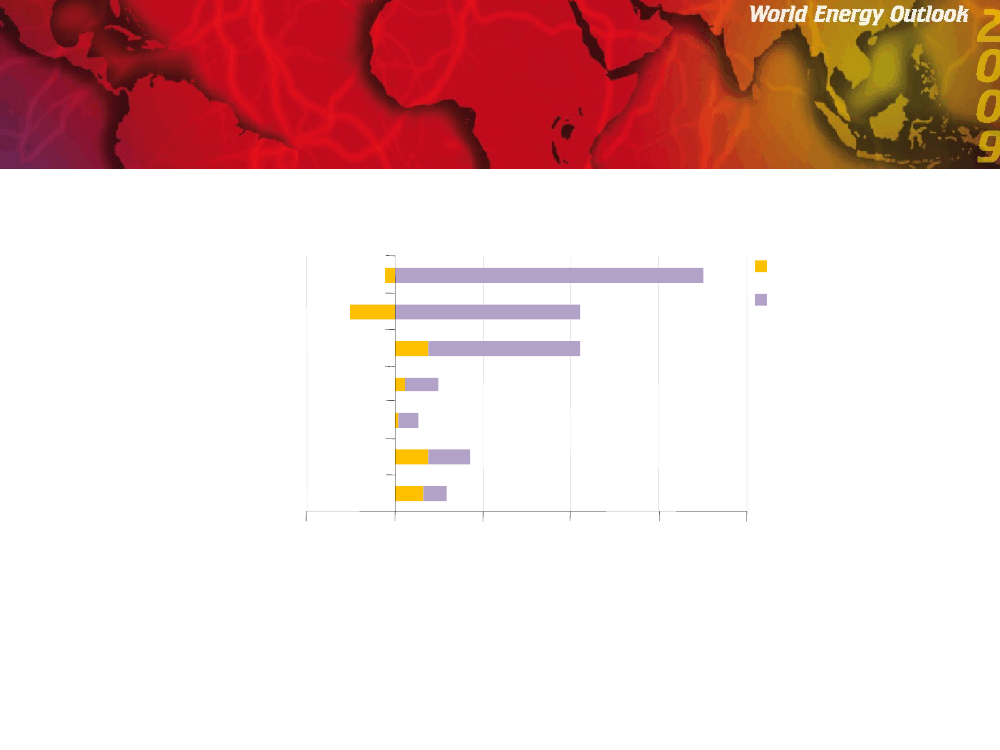
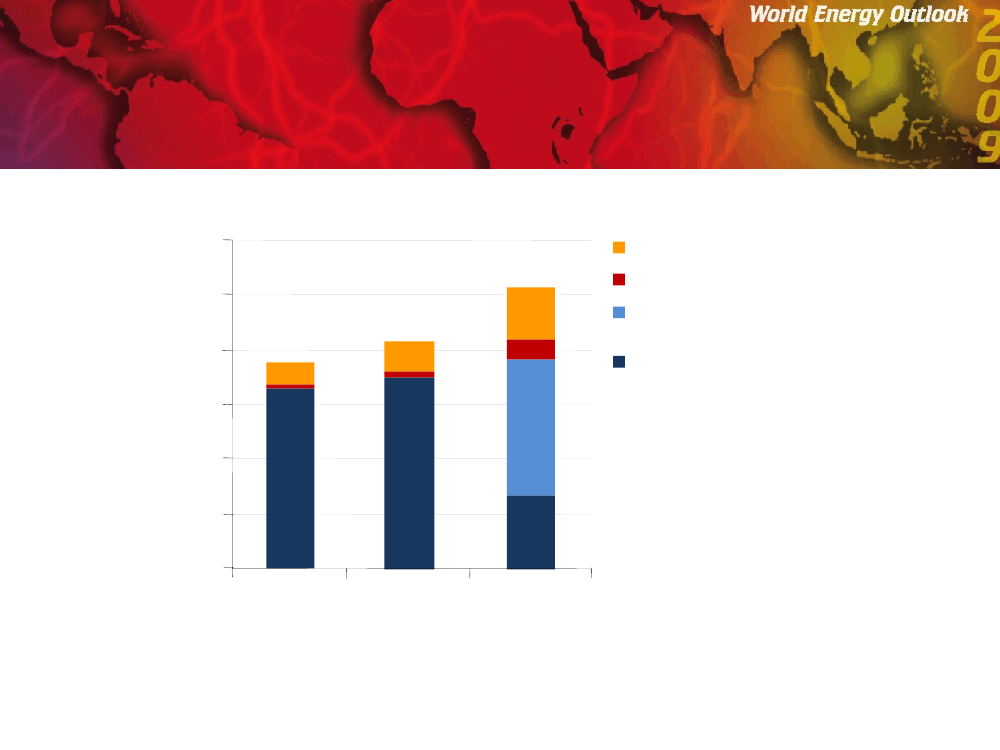
Change in primary energy demandin the Reference Scenario, 2007-20302007-
CoalOilGasNuclear
OECDNon-OECD
HydroBiomassOther renewables
- 500
0
500
1 000
1 500
2 000Mtoe
Fossil fuels account for 77% of the increase in world primary energy demand in 2007-2030,with oil demand rising from 85 mb/d in 2008 to 88 mb/d in 2015 & 105 mb/d in 2030� OECD/IEA - 2009
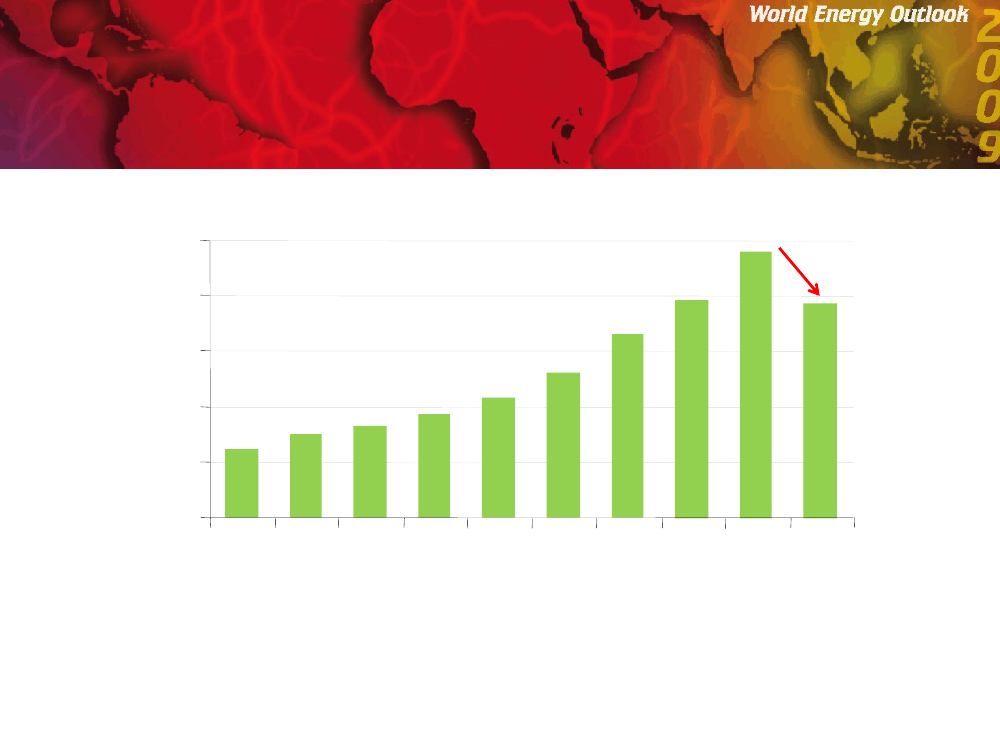
Worldwide upstream oil & gascapital expendituresBillion dollars
5004003002001000200020012002200320042005200620072008 2009** Budgeted spending
Global upstream spending (excluding acquisitions) is budgeted to fall by over $90 billion,or 19%, in 2009 – the first fall in a decade� OECD/IEA - 2009
Oil productionin the Reference Scenariomb/d12010080604020NGLsUnconventional oilCrude oil – fields yet to be developedor foundCrude oil – currently producing fields
0200020082030
Sustained investment is needed mainly to combat the decline in output at existing fields,which will drop by almost two-thirds by 2030� OECD/IEA - 2009
Impact of decline on world natural gas productionin the Reference Scenario
tcm
54321020072015202020252030
100%80%60%40%20%0%
Fields yet to be developed or foundCurrently producing fieldsShare from fields not yet producing(right axis)
Additional capacity of around 2 700 bcm, or 4 times current Russian capacity, is neededby 2030 – half to offset decline at existing fields & half to meet the increase in demand� OECD/IEA - 2009
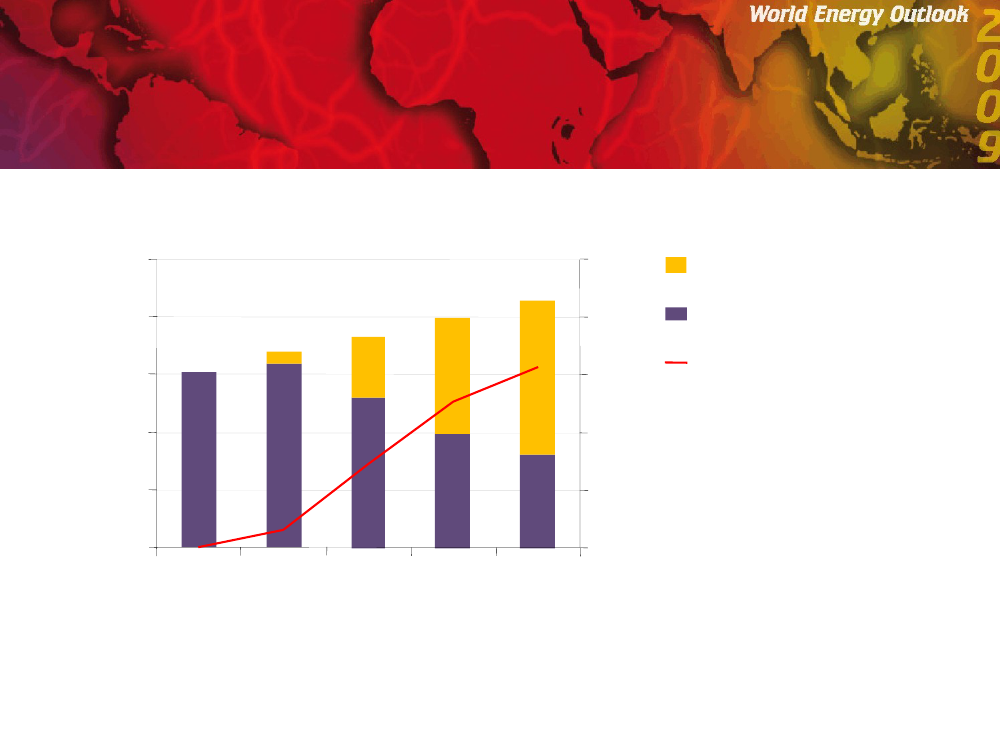
US natural gas supplyin the Reference Scenario700600500
bcm
70%60%50%40%30%20%10%0%
Net importsConventionalUnconventionalShare of unconventionalin total supply
4003002001000
1990 1995 2000 2005 2008 2015 2020 2025 2030
Thanks mainly to shale gas, US gas output grows gradually through to 2030,outstripping demand & squeezing imports� OECD/IEA - 2009
Natural gas transportation capacity
bcm
800700600
73%
Unutilised LNG liquefaction& pipeline capacityLNG tradePipeline trade% Capacity utilisation rate
5004003002001000
88%
2007
2015
A glut of gas is developing – reaching 200 bcm by 2015 – due to weaker than expecteddemand & plentiful US unconventional supply, with far-reaching implications for gas pricing� OECD/IEA - 2009
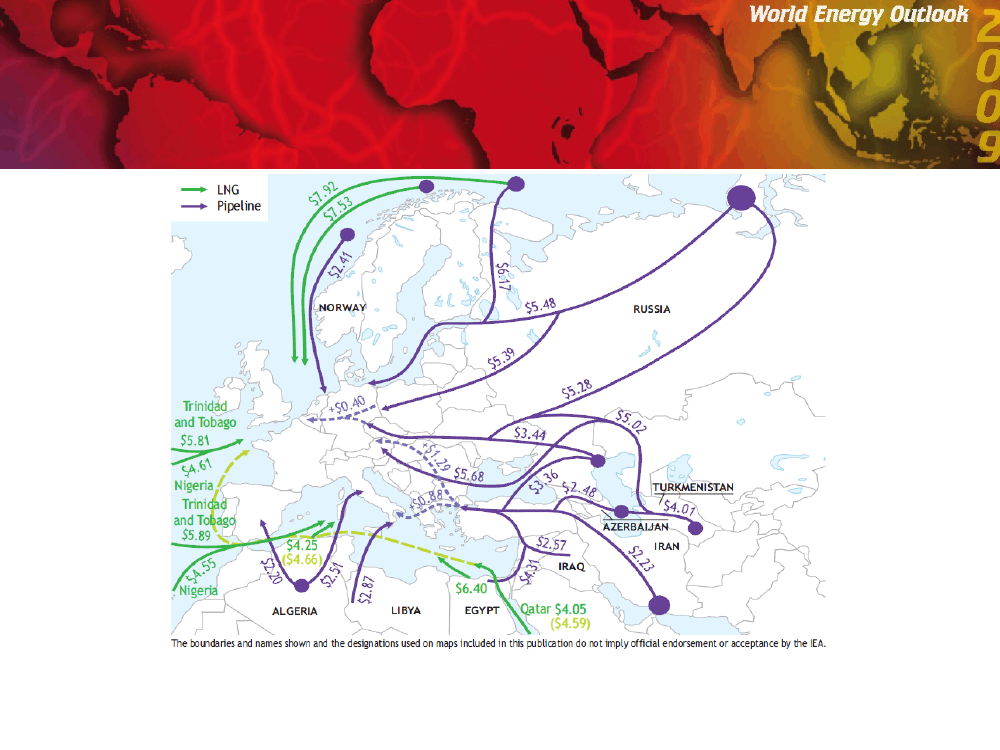
Indicative costs for potential new sources of gasdelivered to Europe, 2020 ($/MBtu)($/MBtu)
Although indigenous resources are limited & output is declining, Europe isgeographically well placed to secure gas supplies from a variety of external sources� OECD/IEA - 2009
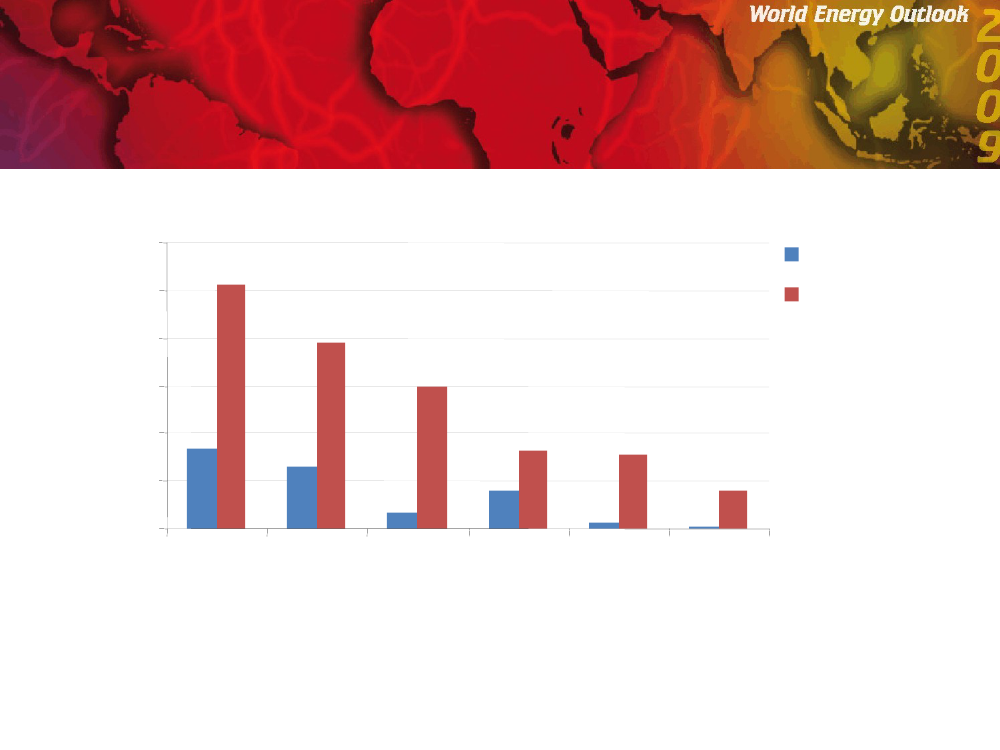
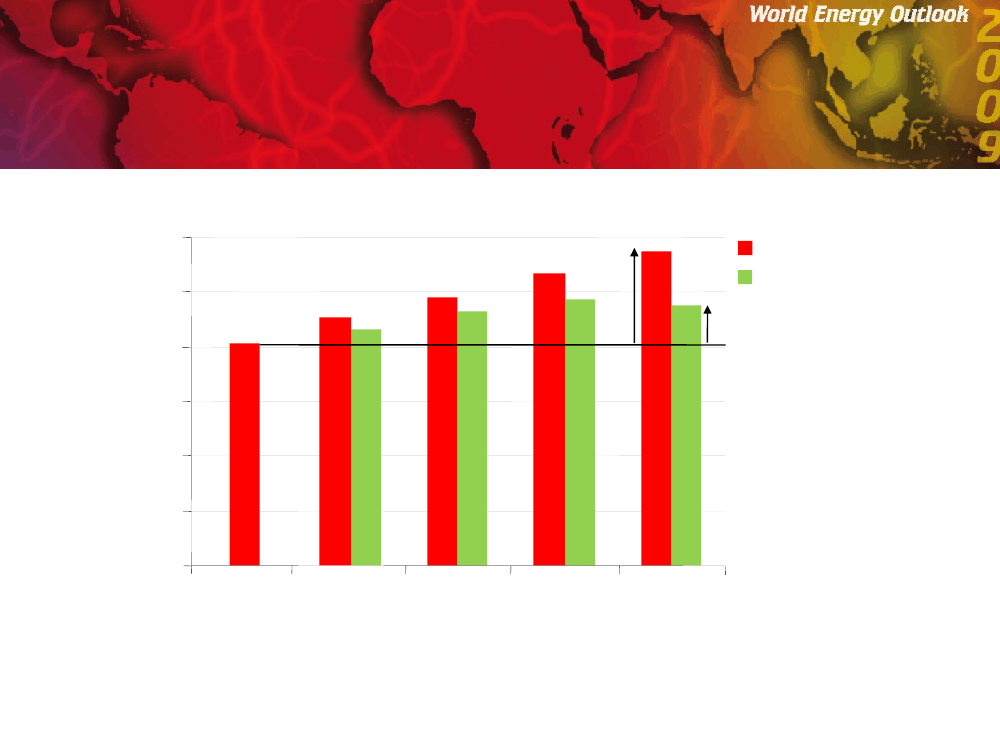
Average annual expenditure on net importsof oil & gas in the Reference ScenarioBillion dollars (2008)6005004003002001000EuropeanUnionUnitedStatesChinaJapan1%2%2%
1971-20082008-2030% Share of GDP3%
1%2%1%
3%
6%3%3%0.4%
India
ASEAN
The Reference Scenario implies persistently high spending on oil & gas imports, with Chinaovertaking the United States by around 2025 to become the world's biggest spender� OECD/IEA - 2009
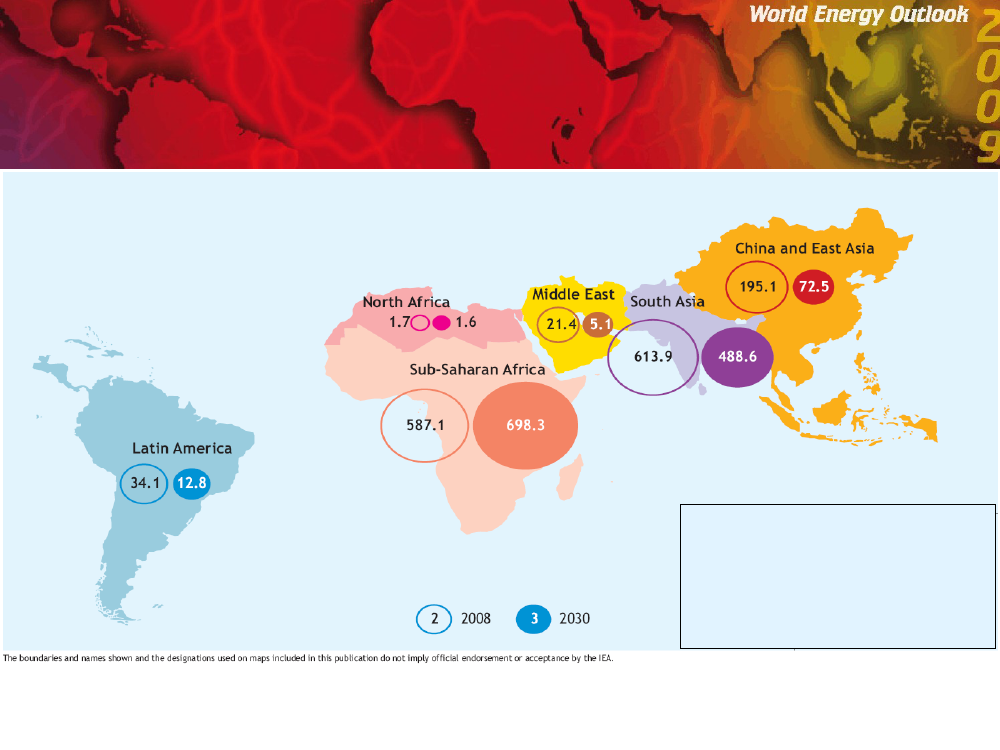
Number of people without access to electricityin the Reference Scenario (millions)
World population withoutaccess to electricity2008: 1.5 billion people2030: 1.3 billion people$35 billion per year more investment than in the Reference Scenario would be needed to 2030– equivalent to just 5% of global power-sector investment – to ensure universal access� OECD/IEA - 2009
The policy mechanismsin the 450 ScenarioA combination of policy mechanisms, which best reflects nations’
varied circumstances & negotiating positionsWe differentiate on the basis of three country groupings>OECD+: OECD & other non-OECD EU countries>Other Major Economies (OME): Brazil, China, Middle East, Russia & South Africa>Other Countries (OC): all other countries, including India & ASEAN
A graduated approach>Up to 2020, only OECD+ have national emissions caps>After 2020, Other Major Economies are also assumed to adopt emissions caps>Through to 2030, Other Countries continue to focus on national measures
Emissions peaking by 2020 will require>A CO2price of $50 per tonne for power generation & industry in OECD+>Investment needs in non-OECD countries of $200 billion in 2020, supported byOECD+ through carbon markets & co-financing� OECD/IEA - 2009
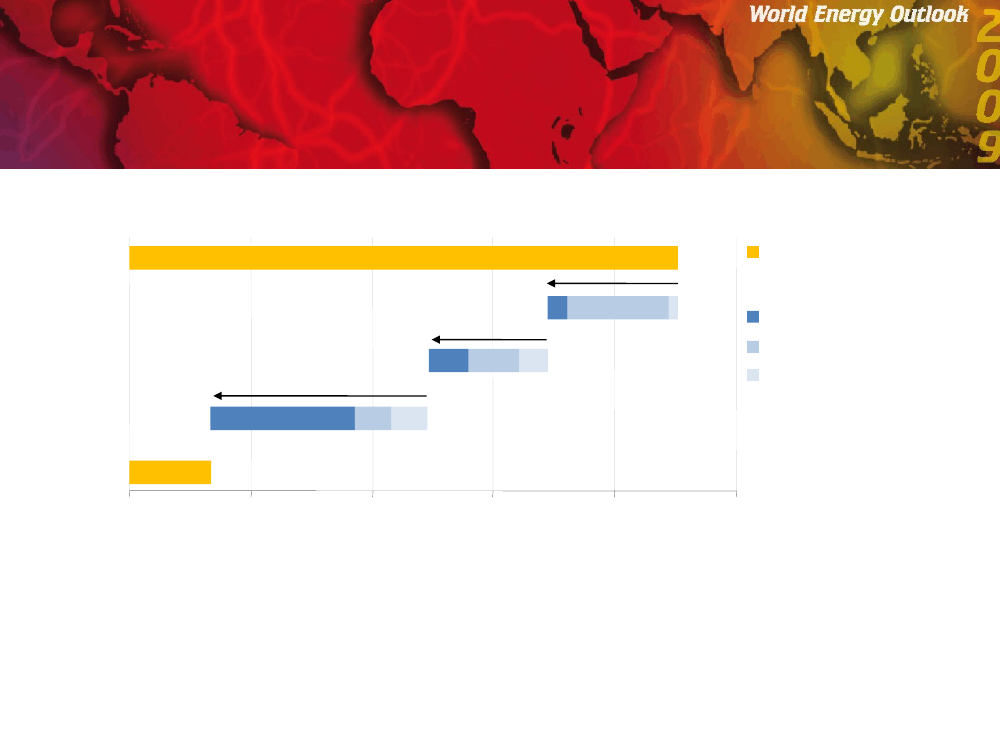
Abatement by policy type in the 450 Scenariorelative to the Reference Scenario, 2020EmissionsAbatement:OECD+Other Major EconomiesOECD+ cap-and-trade forpower and industry(including international credits)450 ScenarioOther Countries
Reference ScenarioDomestic policies and measures
Sectoral agreements
30
31
32
33
34
35Gt
After realising the abatement potential of policies & measures and sectoral approaches,cap-and-trade in OECD+ yields a further 1.8 Gt� OECD/IEA - 2009
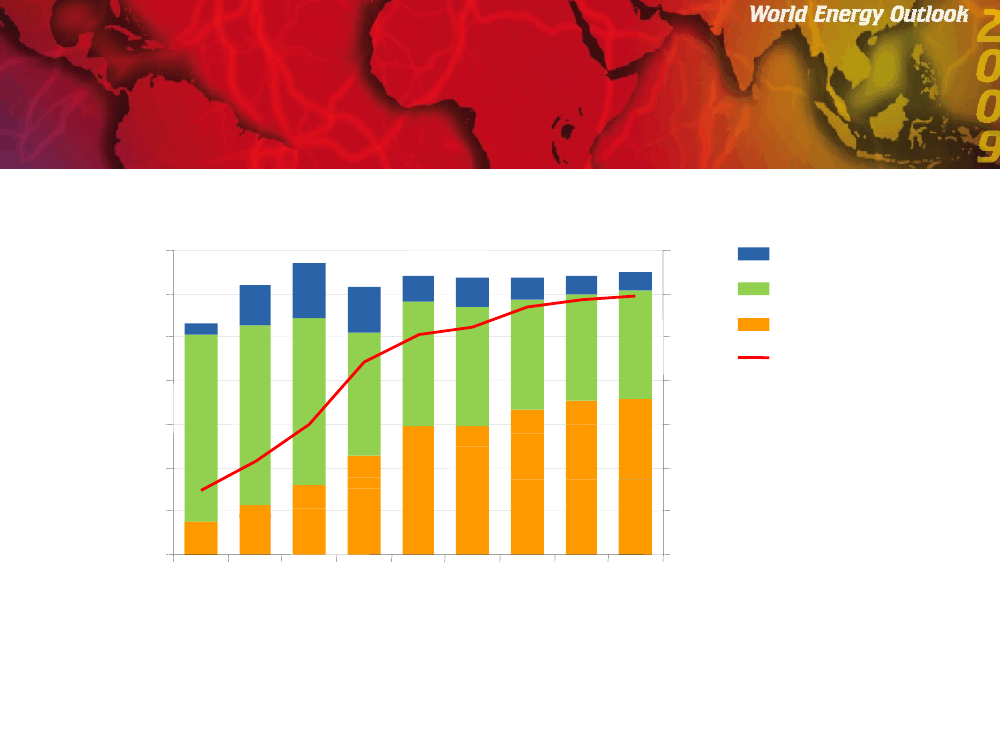
World primary energy demand by fuelin the 450 Scenario
Mtoe
12 00010 0008 0006 000
36%30%24%18%12%6%0%2030
Fossil fuelsZero-carbon fuelsShare of zero- carbon fuels(right axis)
4 0002 00001990
2000
2010
2020
In the 450 Scenario, demand for fossil fuels peaks by 2020, and by 2030 zero-carbon fuelsmake up a third of the world's primary sources of energy demand� OECD/IEA - 2009
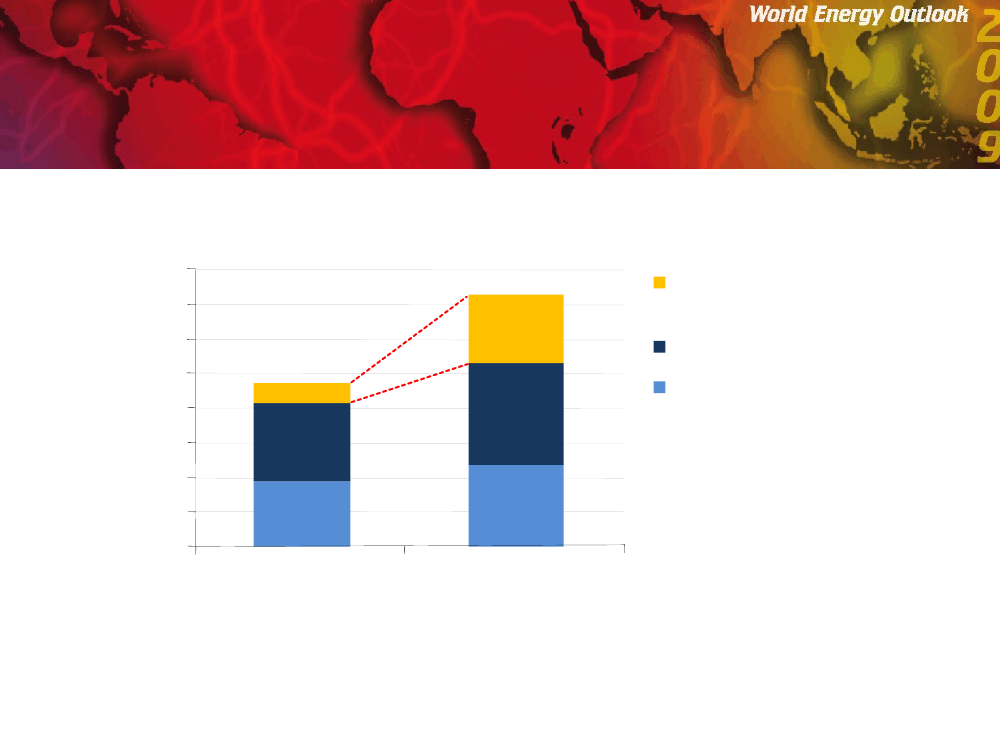
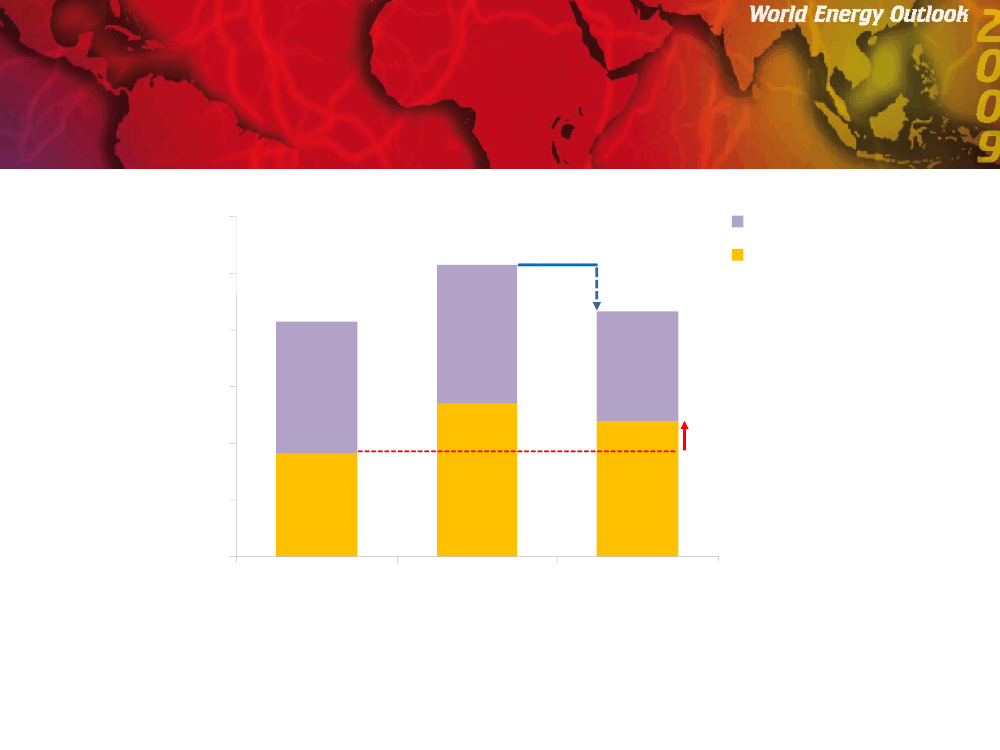
World oil productionby scenariomb/d
12010080604011 mb/d36mb/d
Non-OPECOPEC
16 mb/d
200
2008
Reference Scenario2030
450 Scenario2030
Curbing CO2emissions would also improve energy security by cutting oil demand, but evenin the 450 Scenario, OPEC production increases by 11 mb/d between now and 2030� OECD/IEA - 2009
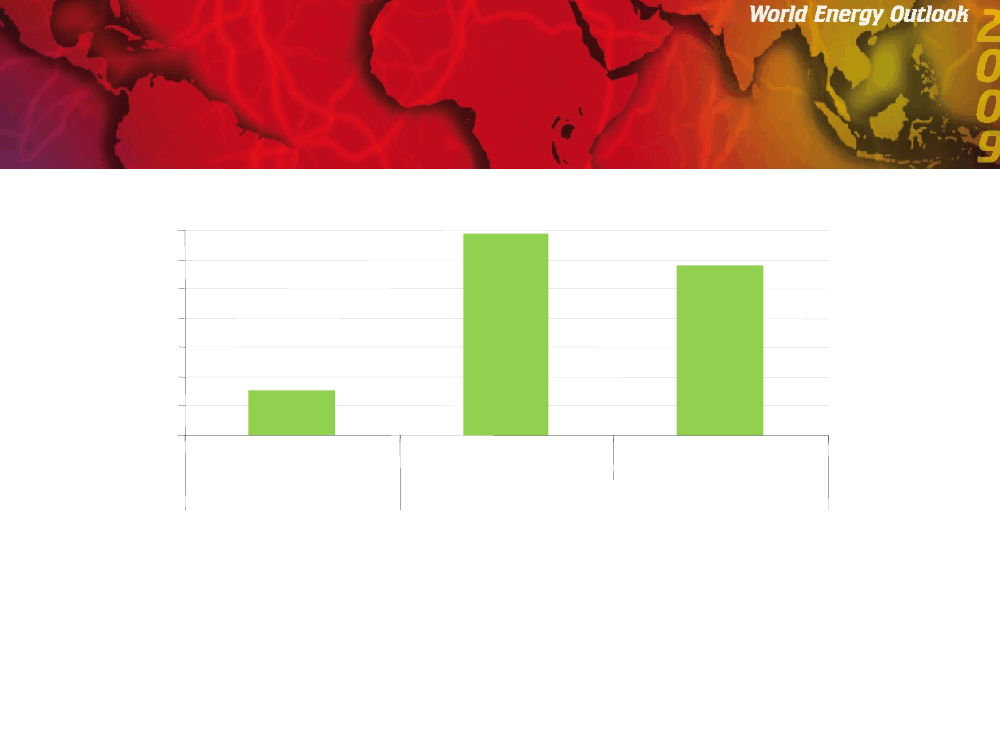
Cumulative OPEC oil export revenuesby scenarioTrillion dollars (2008)2824201612840Reference Scenario1985-20072008-2030450 Scenario
Though slightly lower than in the Reference Scenario, OPEC revenues in the 450 Scenarioare over four times as high as in the last 20 years� OECD/IEA - 2009
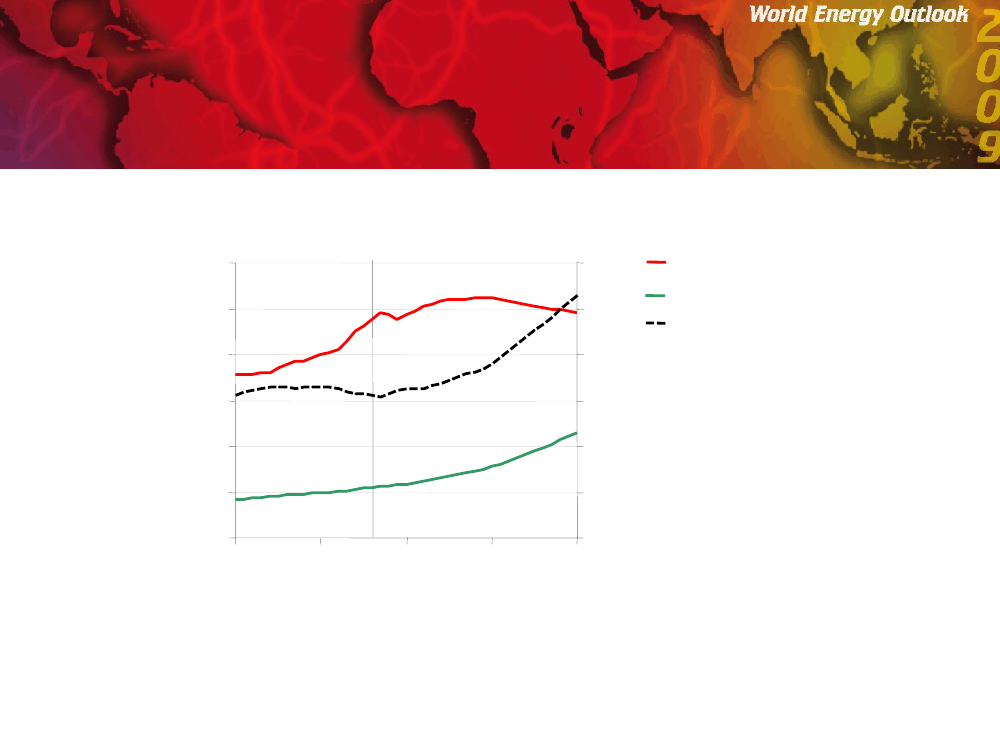
World primary natural gas demandby scenariobcm
4 5003 7503 000
+41% (1 264 bcm)
Reference Scenario450 Scenario+17% (511 bcm)
2 2501 500750020072015202020252030
Gas demand continues to grow in both scenarios, peaking by around 2025 in the 450 Scenario& highlighting the potential role of gas as a transition fuel to a clean energy future� OECD/IEA - 2009
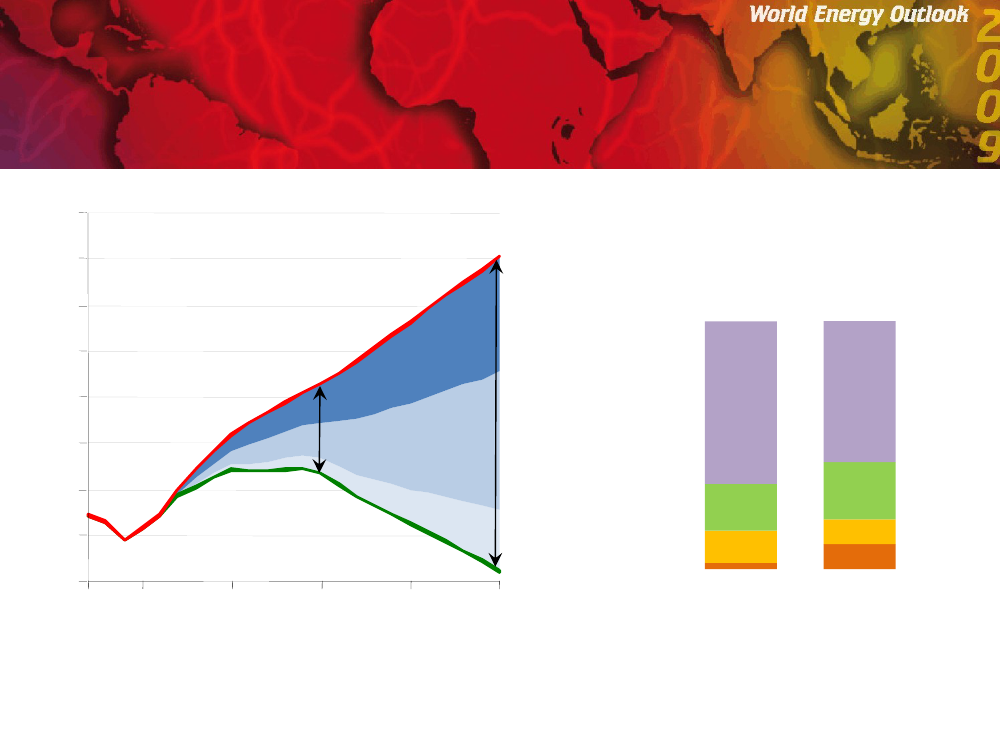
World abatement of energy-related CO2emissionsenergy-in the 450 ScenarioGt
424038OECD+3634323028OC450 Scenario20152020202520303.8 Gt13.8 GtOMERenewables& biofuelsNuclearCCS19%13%3%23%10%10%Efficiency65%57%Reference ScenarioWorld abatement by technology20203.8 Gt203013.8 Gt
262007 2010
An additional $10.5 trillion of investment is needed in total in the 450 Scenario, withmeasures to boost energy efficiency accounting for most of the abatement through to 2030� OECD/IEA - 2009
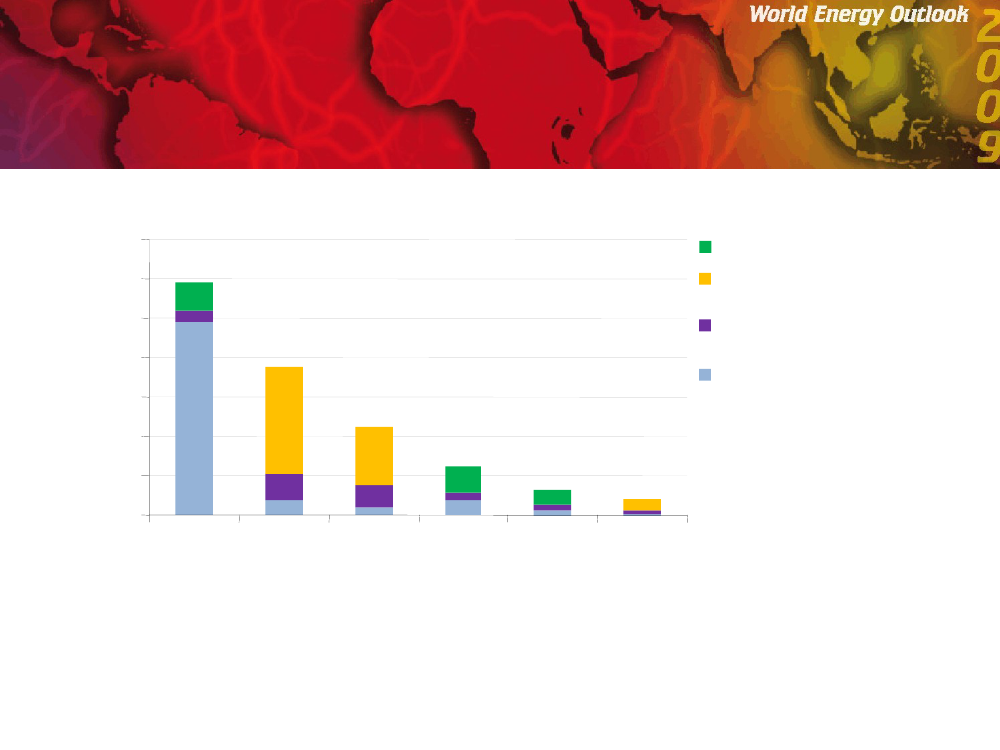
Abatement in the 450 Scenario by key emitters, 2020
Gt
1.41.21.00.80.60.40.20
International carbon marketsCap & trade in power& industry sectorsInternation sectoral standardsin transport & industryNational policies
China
UnitedStates
EuropeanUnion
India
Russia
Japan
China, the United States, the European Union, India, Russia & Japan account for almostthree-quarters of the 3.8 Gt reduction in the 450 Scenario� OECD/IEA - 2009
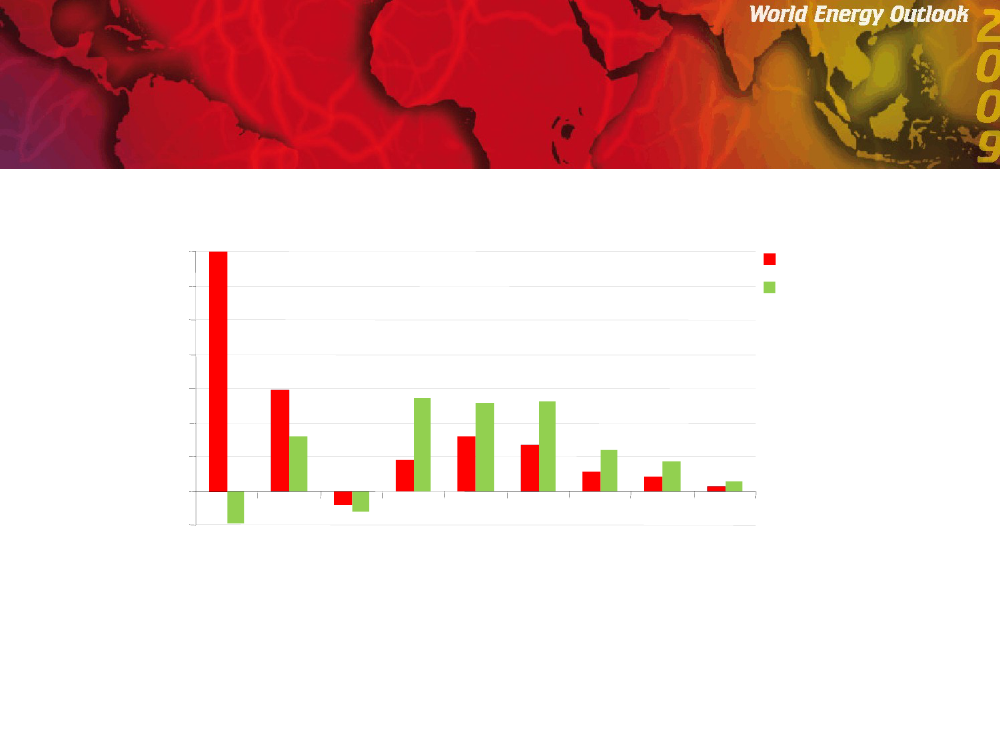
Incremental world electricity productionin the Reference and 450 Scenarios, 2007-20302007-7 0006 000
TWh
Reference Scenario450 Scenario
5 0004 0003 0002 000
1 0000-1 000CoalGasOilNuclear Hydro Wind Biomass Solar Otherrenewables
Renewables, nuclear and plants fitted with CCS account for around 60% of electricitygeneration globally in 2030 in the 450 Scenario, up from less than one-third today� OECD/IEA - 2009
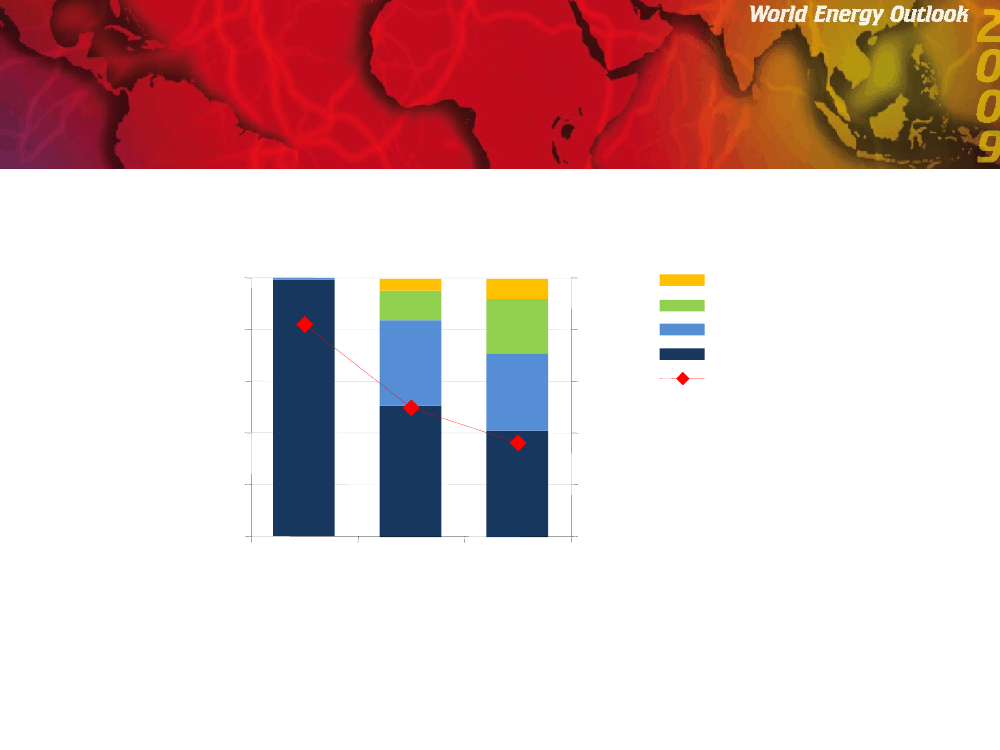
World passenger vehicle sales & average new vehicleCO2intensity in the 450 Scenario
80%
200
20560%40%20%0%200720202030
1501259010050
0
Improvements to the internal combustion engine & the uptake of next-generation vehicles &biofuels lead to a 56% reduction in new-car emission intensity by 2030� OECD/IEA - 2009
Grammes per kilometre
Share of sales
100%
250
Electric vehiclesPlug-in hybridsHybrid vehiclesICE vehiclesCO2intensityof new vehicles(right axis)
Summary & conclusionsThe financial crisis has halted the rise in global fossil-energy use, but its
long-term upward path will resume soonon current policiesTackling climate change & enhancing energy security require a massivedecarbonisation of the energy system>We are now on course for a 6�C temperature rise & rising energy costs
>Limiting temperature rise to 2�C will require big emission reductions in all
regions
A 450 path towards ‘Green Growth’ would bring substantial benefits>Avoiding the worst effects & costs of climate change
>Energy-security benefits, lower oil & gas imports & reduced energy bills
>Much less air pollution & huge health benefits
Natural gas can play a key role as a bridge to a cleaner energy futureThe challenge is enormous – but it can and must be met>Improved energy efficiency & technology deployment are critical
>Each year of delay adds $500 bn to mitigation costs between today & 2030
� OECD/IEA - 2009