Det Energipolitiske Udvalg 2009-10
EPU Alm.del Bilag 128
Offentligt
Design of Feed-in Tariffsfor Sub-5MW Electricity inGreat Britain
Quantitative analysis forDECC
Final ReportJuly 2009
URN 09D/704
Element Energy Limited60 Newman StreetLondonW1T 3DATel: 020 7462 5299Fax: 020 7323 4546
Design of Feed-in Tariffs for Great BritainFinal Report
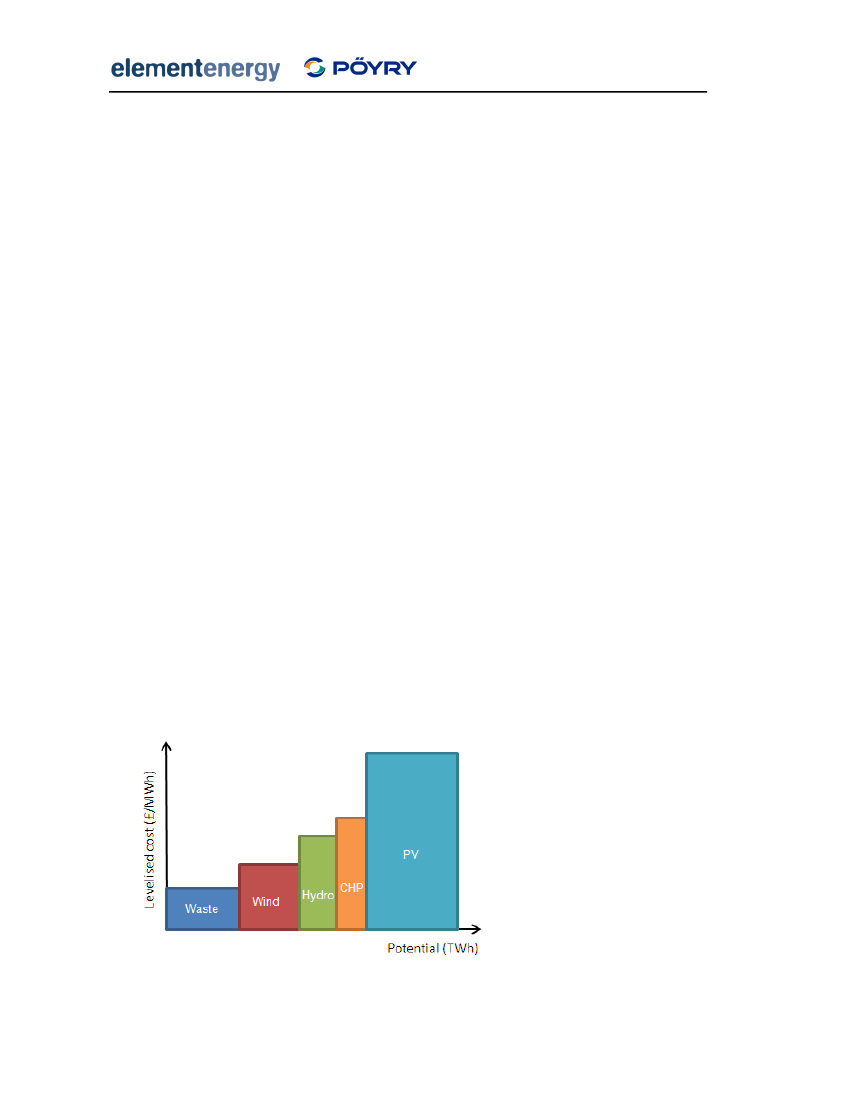
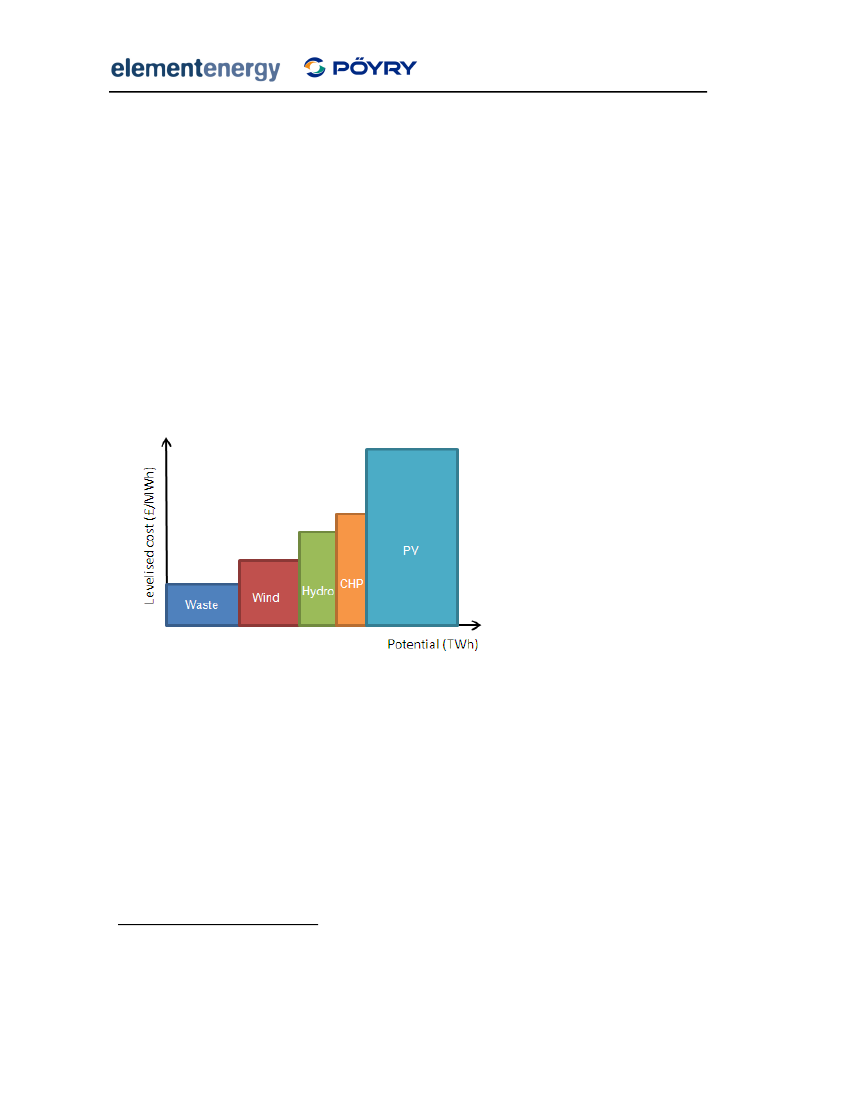
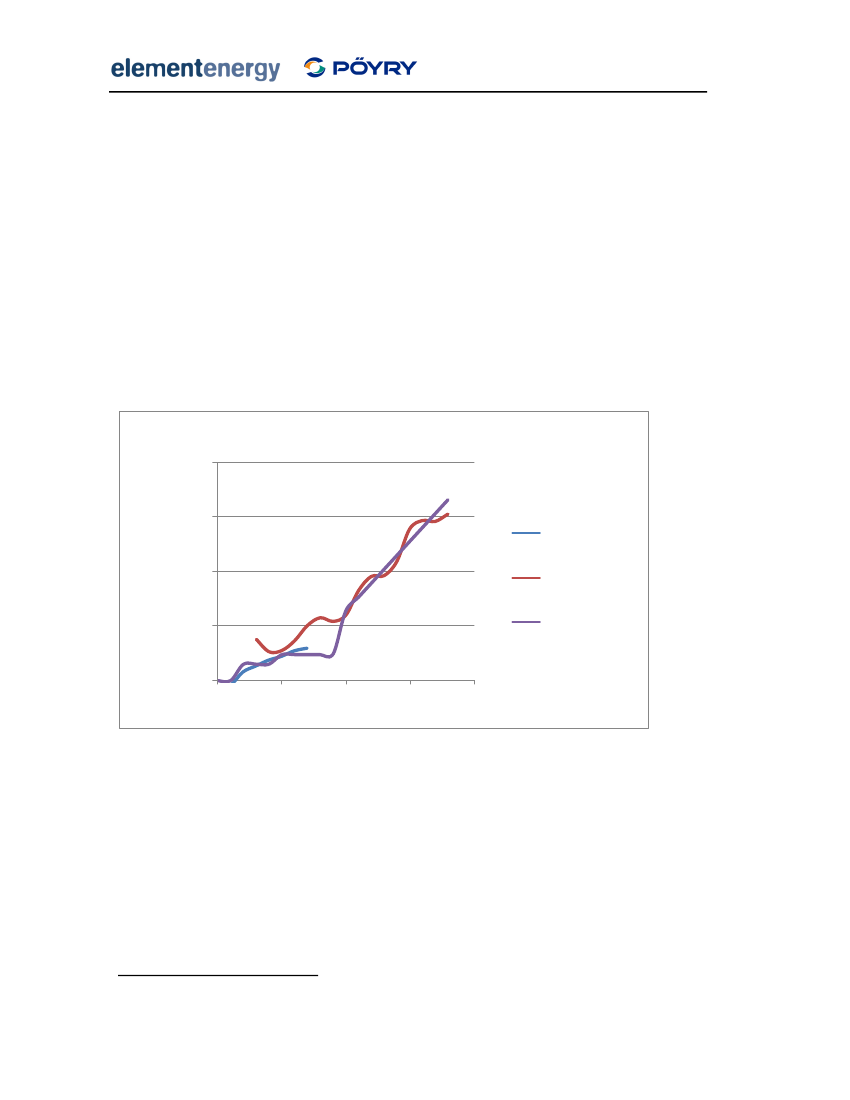
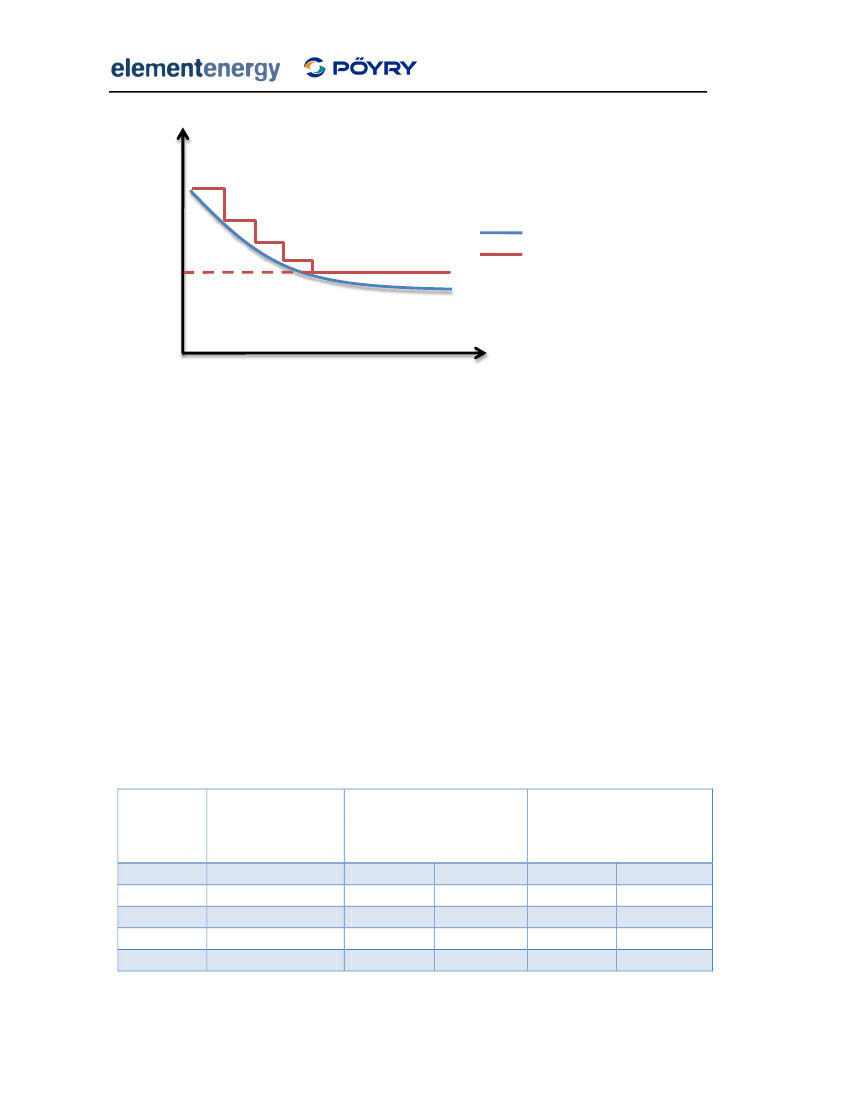
1 Executive SummaryThe EU Renewable Energy Directive sets the UK an ambitious target of meeting 15% of itsfinal energy consumption using renewable energy sources by 2020. In conjunction with alarge increase in the use of renewable heat and, to a lesser extent, renewable transport fuels,renewable electricity is expected to make a major contribution to the achievement of thistarget. Recent changes to the Renewables Obligation (RO) are predicted to deliver largeamounts of renewable electricity from large-scale technologies, such as onshore and offshorewind. However, the banding of support within the RO does not provide sufficient incentivesto small-scale renewable generators to encourage widespread uptake. For this reason, in theEnergy Act 2008 the Government took powers to introduce a Feed-in Tariff for renewableelectricity technologies up to 5MWein size and gas CHP systems up to 50kWe. ElementEnergy and Pöyry Energy Consulting were contracted by the Department of Energy andClimate Change to conduct a detailed review and analysis of the options for designing a Feed-in Tariff for Great Britain.MethodologyThe modelling approach is based on the construction of renewable electricity supply curvesshowing the size of the resource available at a given generating cost, as shown in Figure 1.The resource potentials for each technology were estimated using a combination of industryconsultation, literature review and primary analysis using Geographical Information Systems(GIS). The resource potentials were combined with a technology cost and performancemodel, and a representation of investor behaviour based on telephone discussions withrenewable energy investors. The resulting model is able to project uptake of each renewabletechnology under a wide range of feed-in tariff designs.
Figure 1 Illustrative renewable energy supply curve
2
Design of Feed-in Tariffs for Great BritainFinal Report
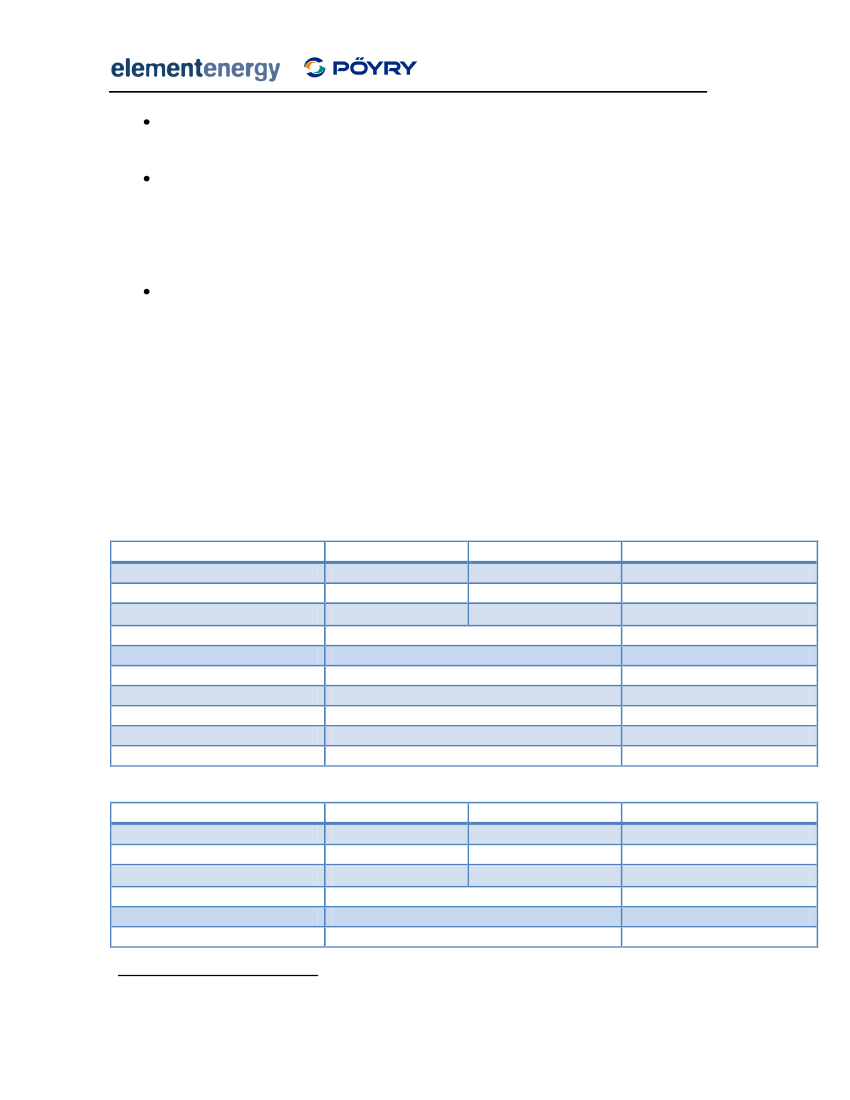
Following discussions with DECC, the following technologies were considered in the model:PhotovoltaicsOnshore windHydroelectric powerWave powerTidal powerBiomass CHPWaste to energy technologiesGas-fired CHPSewage gas and landfill have been deployed on a large scale under the RenewablesObligation. For the purposes of the modelling, it is assumed that these two technologiescontinue to receive support under the RO and are not supported under the FIT. In the mainscenarios investigated, it is assumed that biomass electricity installations that do not makeuse of waste heat are not supported under the Feed-in Tariff. The interactions between theFIT and the Renewable Heat Incentive are discussed in the Analysis.A representation of large-scale investor behaviour was developed based on telephonediscussions with renewable energy investors. Investors are assumed to have technology-specific hurdle rates that they use when assessing the financial case investing in renewabletechnologies1. These hurdle rates vary from 8% for utilities investing in establishedtechnologies such as large wind turbines, to 14% for commercial developers investing innovel technologies such as Advanced Thermal Treatment of waste. To reflect the range ofhurdle rates observed among investors in the real world, a distribution of hurdle rates wasassumed, with early adopters requiring only 8% returns for all technologies before investing.Small-scale investors, such as householders and commercial building owners, are assumed tohave a wider range of hurdle rates, which is consistent with the literature on energyefficiency purchases. For example, householders have a minimum hurdle rate of 3%, close tothe social discount rate, and a maximum rate of 20%.Assessment of the potential for sub-5MW electricityThe total technical resource was estimated for each of the technologies considered in themodel. The technical potential represents the upper bound for the amount of a technologythat can be deployed if sufficient policy and financial support were provided. The technical1
An investor’s hurdle rate is the minimum financial return they would require from a project in orderto invest in it.
3
Design of Feed-in Tariffs for Great BritainFinal Report
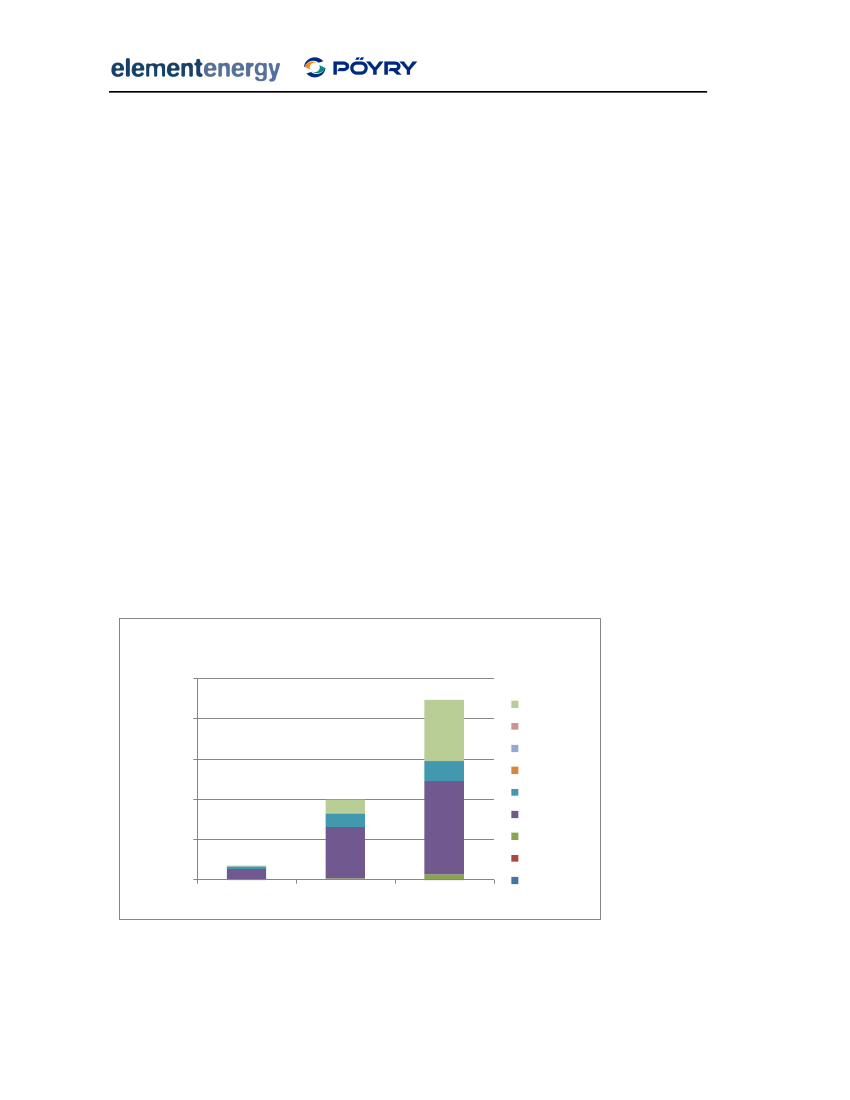
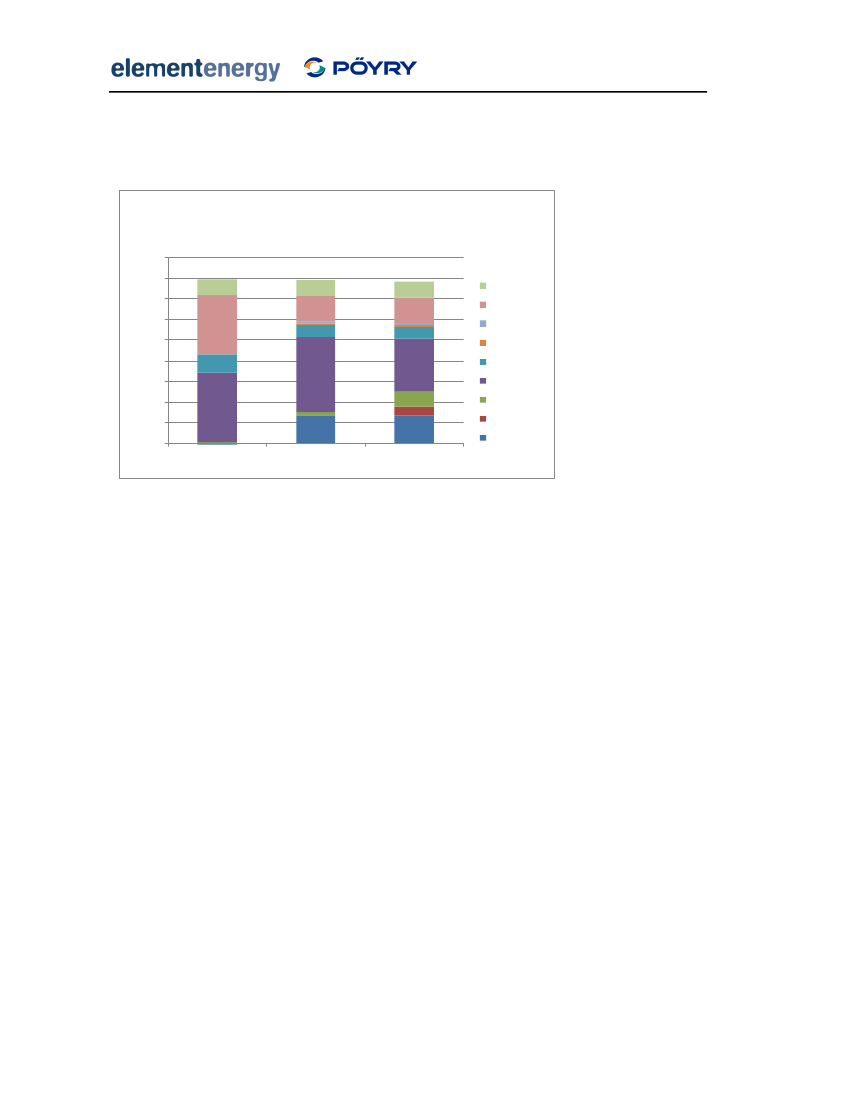
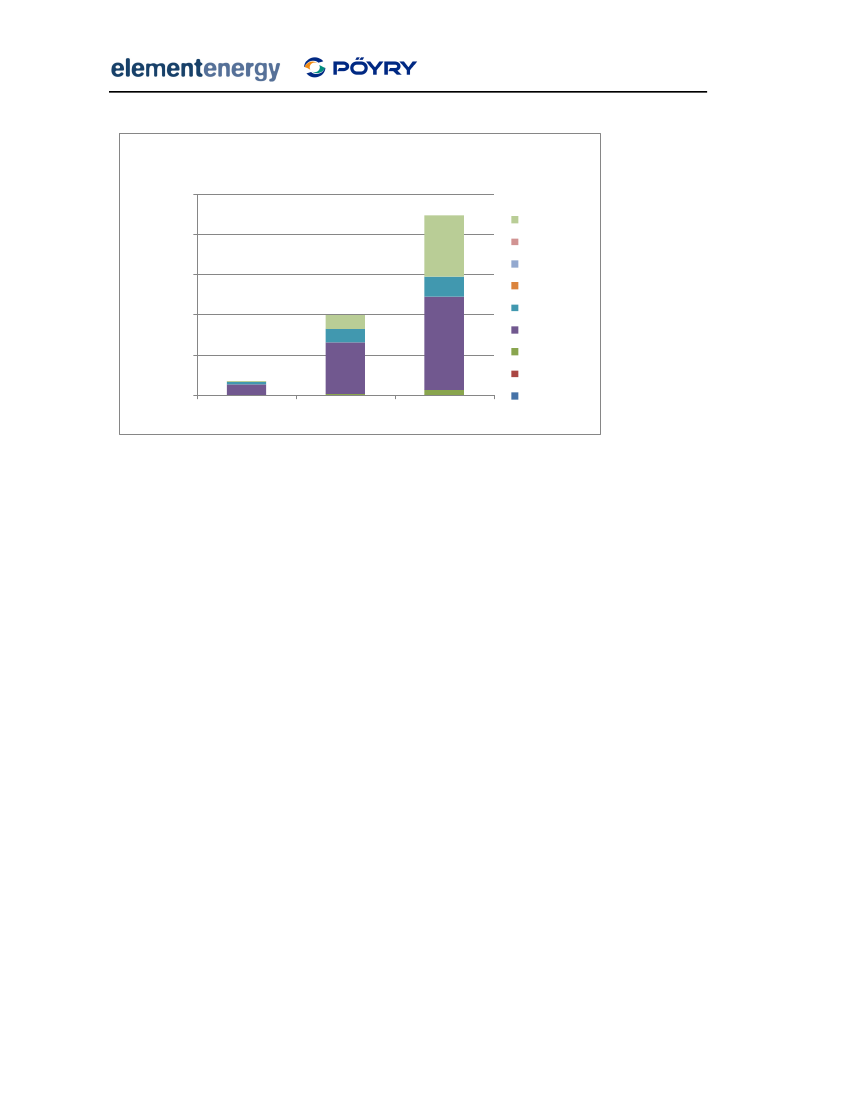
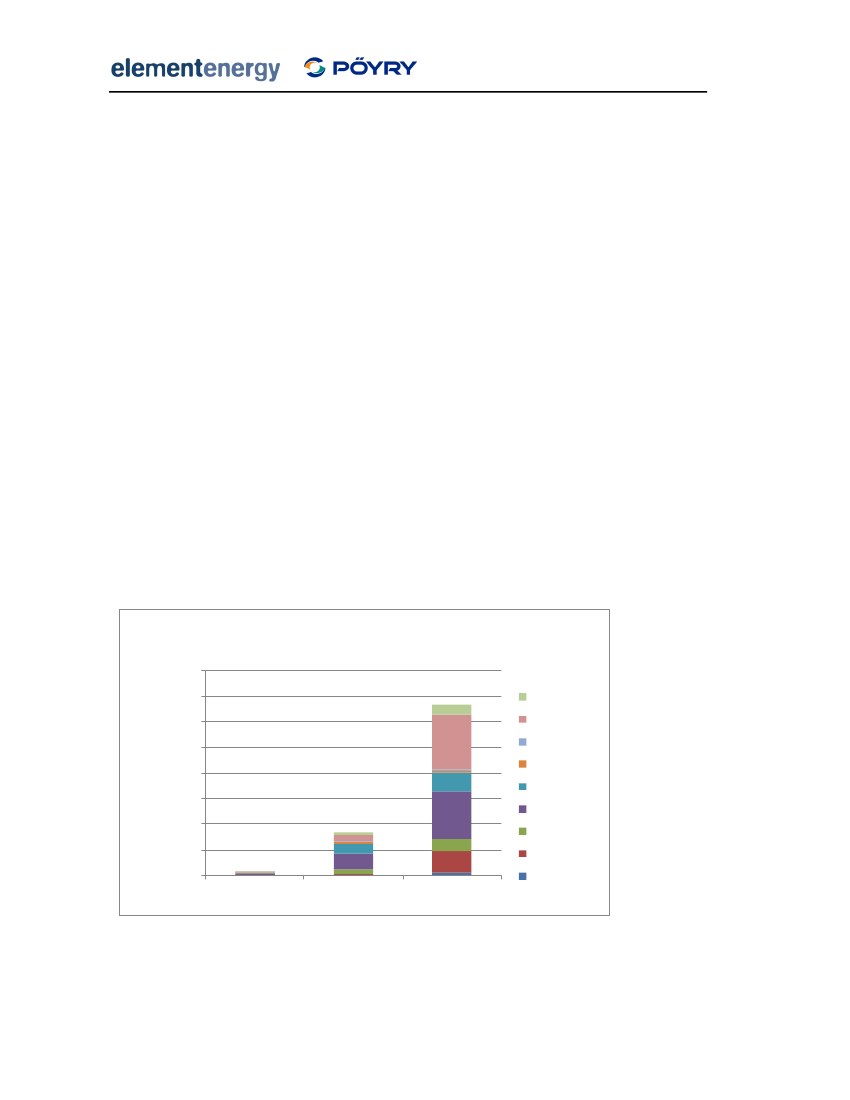
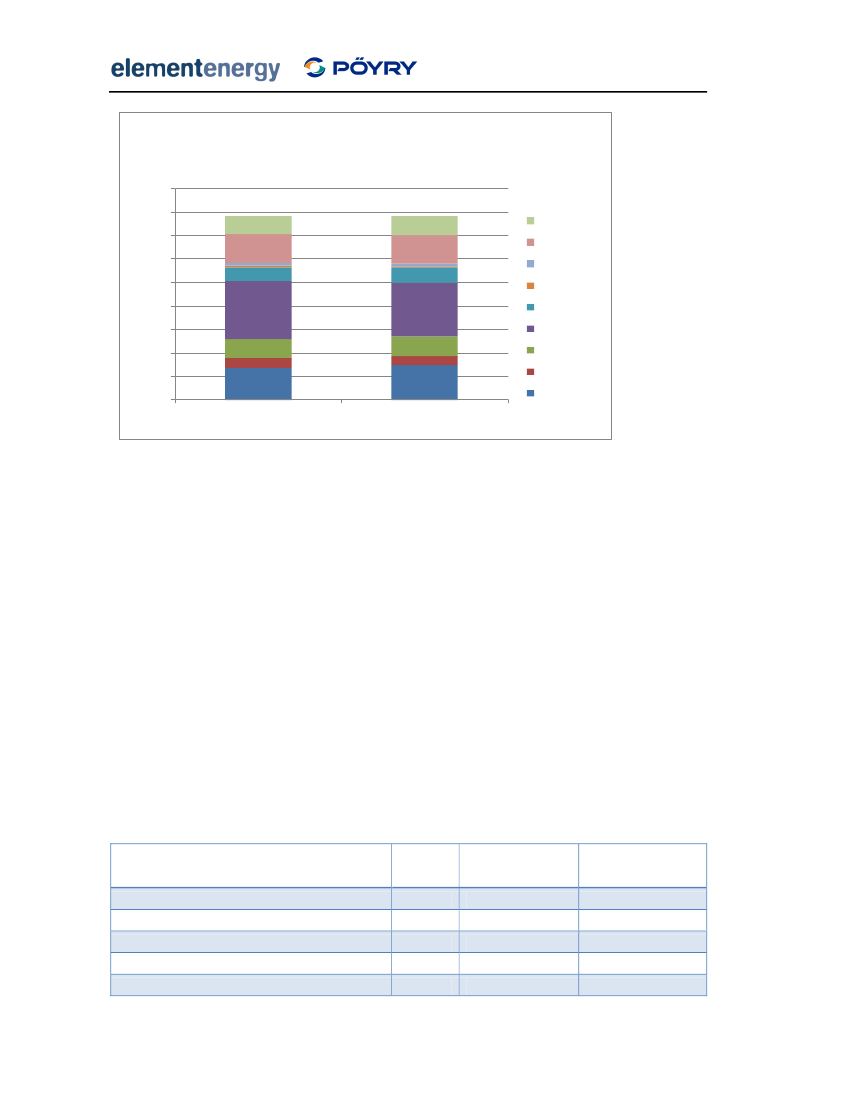
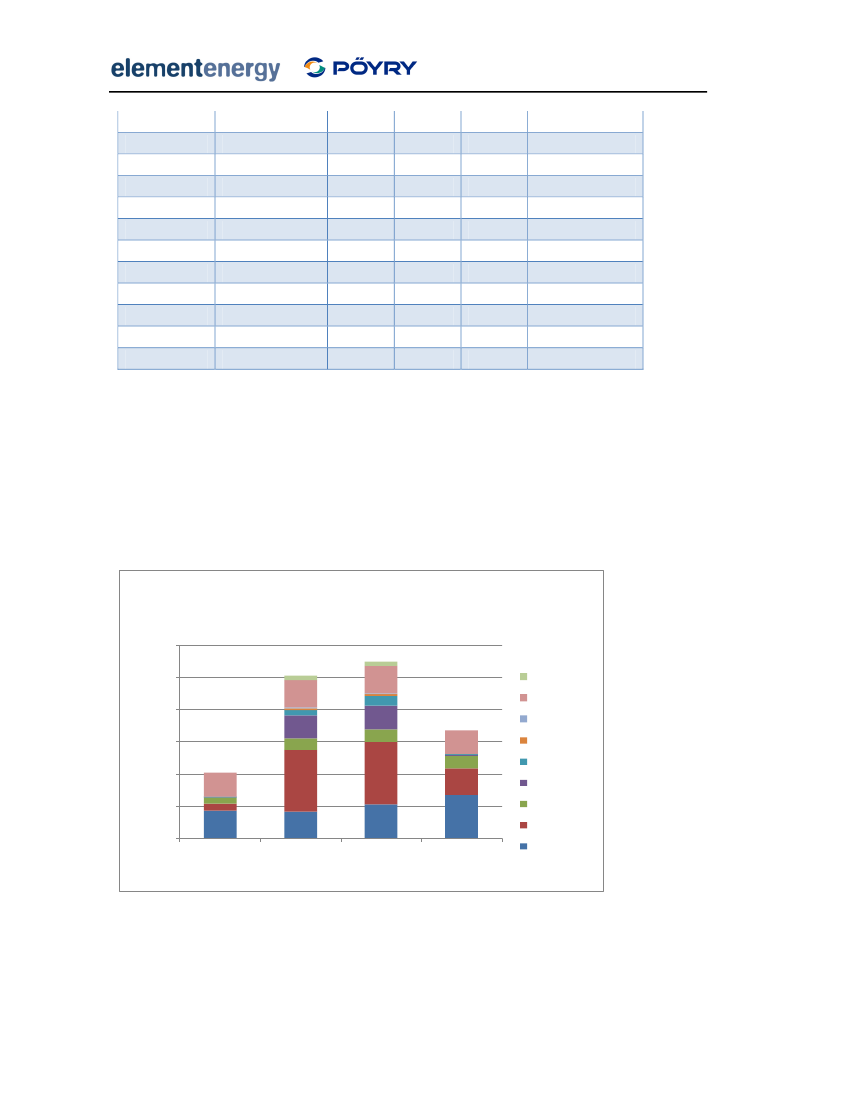
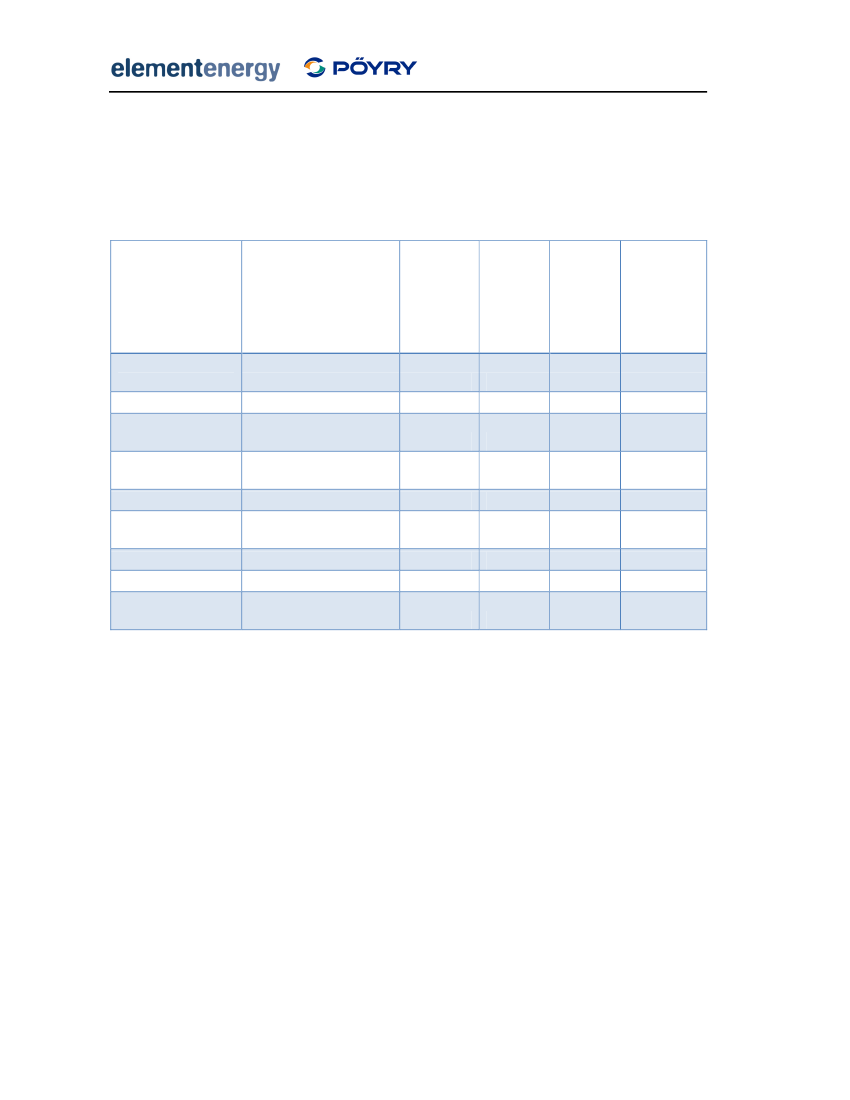
potential does not include time-dependent constraints such as the maximum growth rate ofthe industry or a limit on consumer demand in a given year; these constraints are imposed onthe absolute supply curves to give dynamic supply curves, which show the resource availablein a given year.Barriers are implemented at several points in the model. These dictate the level ofdeployment in a given year, and are caused by both market and social constraints. Themarket constraint is based on the ability of an industry to supply a demand for renewableenergy technologies. The social barriers represent the social acceptance of renewabletechnologies changing as more are deployed. For example, it is assumed that socialacceptance of wind-power decreases with increasing deployment as impacts from multipledevelopments begin to accumulate. Finally, an overall market growth constraint is applied toeach technology, which limits the year on year growth of the industry. This is particularlyimportant in the early years of the policy, where industries must grow rapidly from a smallinitial size.BaselineIn order to assess the impacts of the Feed-in tariff scenarios, a baseline was established thatprojected uptake of sub-5MW technologies under Business as Usual. The baseline assumesthat the banded RO continues to be the primary support measure for all technologies. Figure2 shows the uptake from sub-5MW technologies in the baseline. Over 2TWh of electricity isgenerated from new installations in 2020, and the generation is provided exclusively by large-scale technologies such as on-shore wind, hydro and waste.Total electricity generation by sub-5MW RES-E bytechnology - BaselineTotal electricity generation (GWh per year)
2,500Waste2,0001,5001,000Bio
TidalWaveHydro
Wind (Large)5000201020152020Wind (Small)PV (Large)
PV (Small)
Figure 2 Electricity generation from sub-5MW technologies in the baseline
Policy results4
Design of Feed-in Tariffs for Great BritainFinal Report
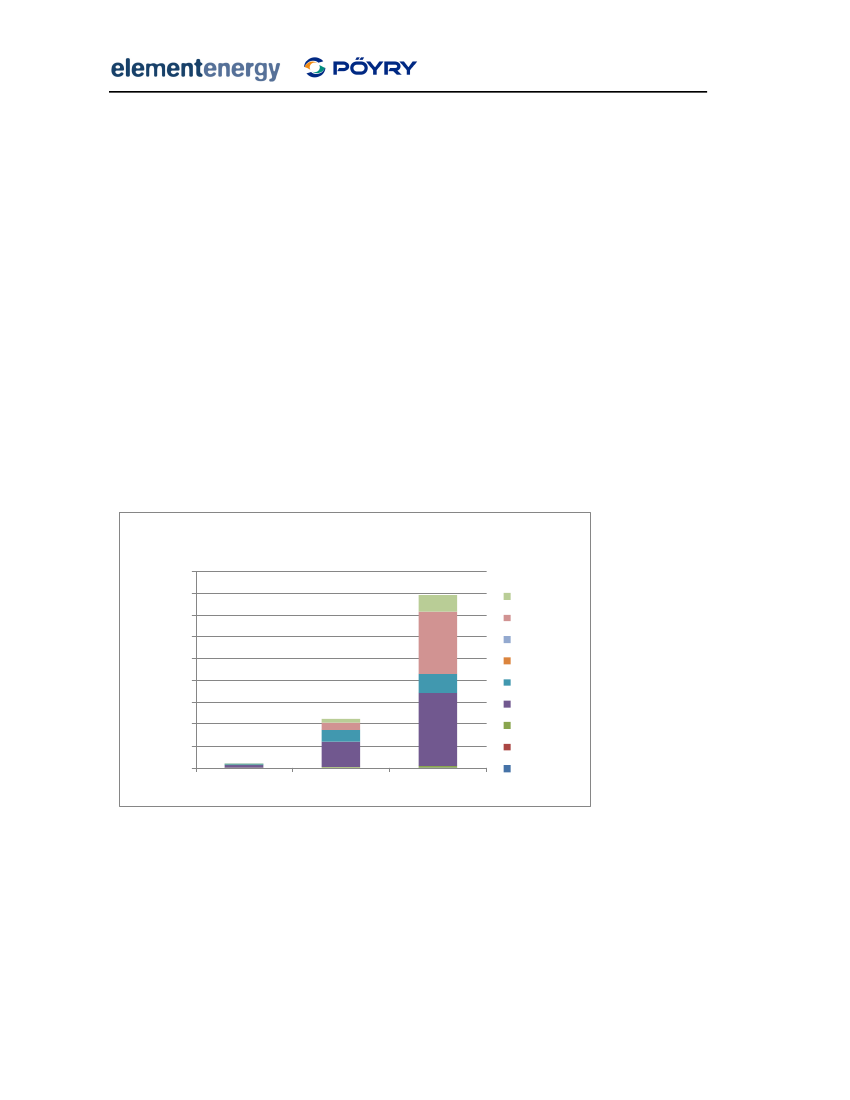
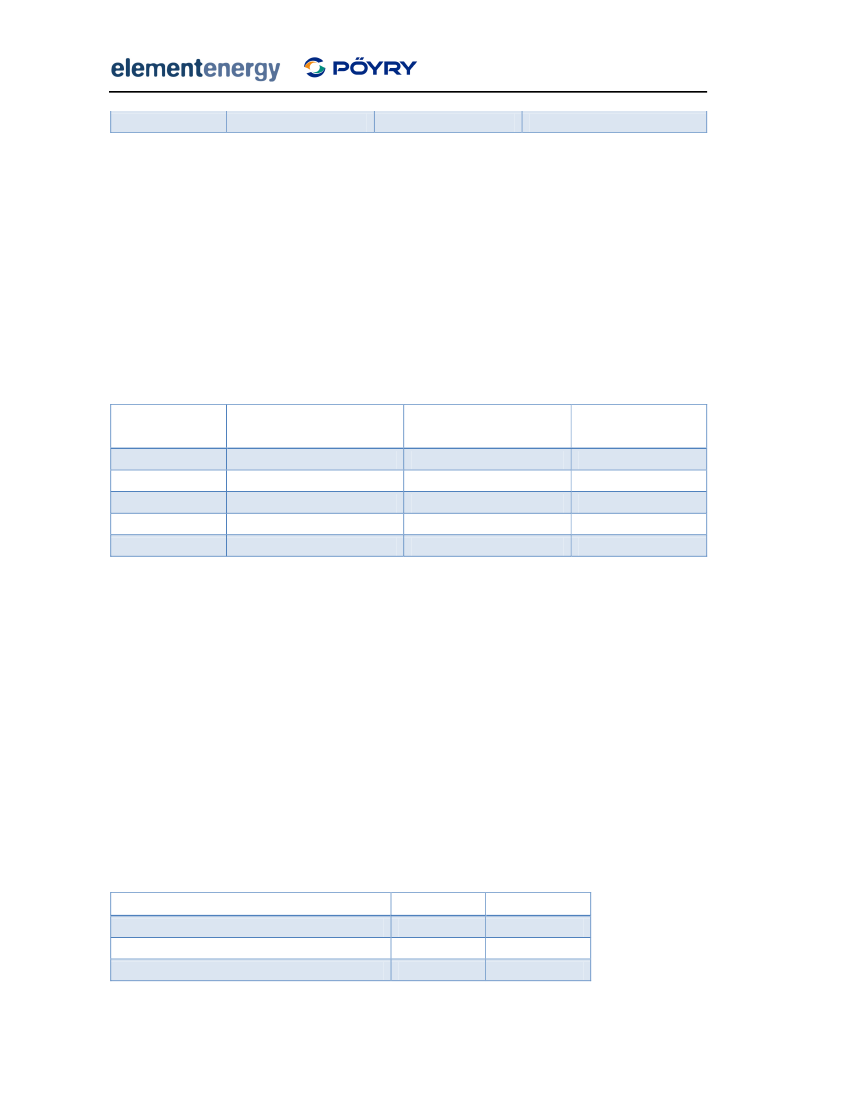
The design of the Feed-in Tariff and the support levels paid to different technologies isguided by the overall aims for the policy. A scheme designed to meet a specific electricitygeneration target at the lowest cost to consumers and the economy will deliver a technologymix that is very different from a scheme designed to drive uptake of domestic – andcommunity-scale installations. To allow easier comparison between scenarios, a totalelectricity generation target for 2020 was set so that the overall technology deployment wasconstant between runs. Following discussions with DECC, two targets were used in themodelling, corresponding to 2% and 3.5% of UK electricity. This is equivalent to 8TWh and13.5TWh based on DECC’s projection of UK electricity demand in 2020. Figure 3 shows thetechnology mix for a flat tariff of £155/MWh. This tariff level is the minimum tariff requiredto provide 8TWh of generation in 2020. In other words, it is equal to the generating cost ofthe most expensive technology required to meet the target. This tariff is paid to allrenewable generators, and includes the market electricity price. It is assumed to stayconstant throughout the policy to 2020. Although the total deployment in this scenario issignificantly larger than in the baseline, the majority of generation is still from large-scaletechnologies. Over 2.5TWh of biomass CHP is deployed by 2020, almost all of which is instandalone installations rather than those connected to district heating sites, due to the highadditional cost of installing a district heating system.Total electricity generation by sub-5MW RES-E bytechnology - 2% least costTotal electricity generation (GWh per year)9,0008,0007,0006,000WasteBio
TidalWaveHydro
5,0004,0003,0002,0001,000
Wind (Large)Wind (Small)PV (Large)
0201020152020
PV (Small)
Figure 3 Electricity generation from sub-5MW renewables - £155/MWh tariff
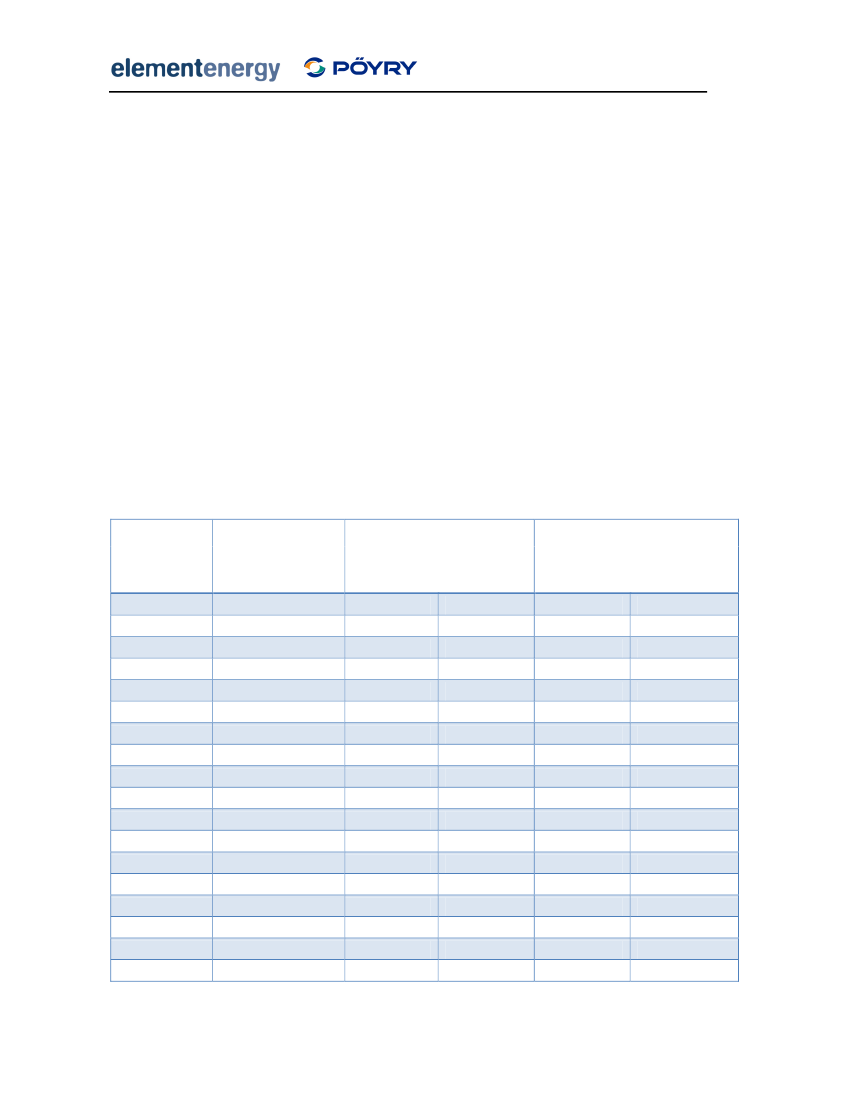
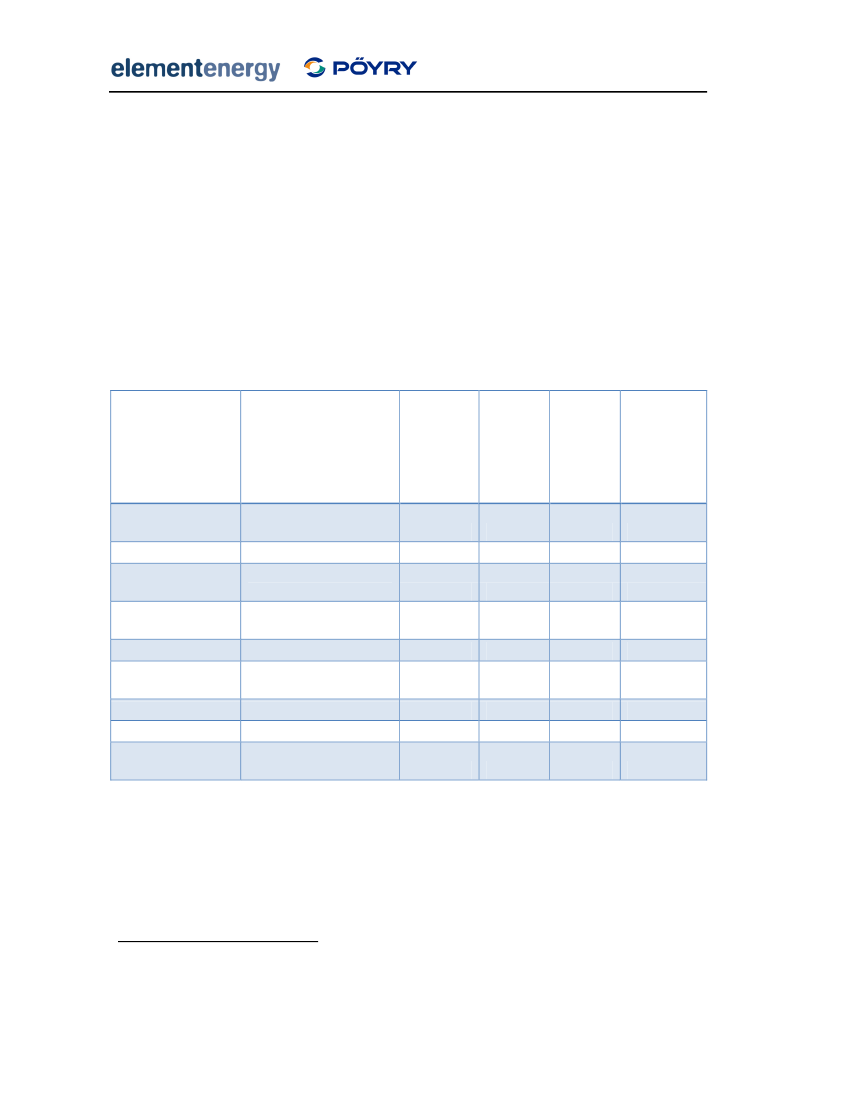
An alternative to pursuing a least cost approach in the design of the policy is to aim tostimulate across a wide range of technologies and scales. For small-scale consumers who canonly access small, higher-cost technologies, tariffs significantly higher than £155/MWh arerequired. Table 1 shows the tariff levels for two scenarios that result in more diversetechnology mixes. In the ‘community bias’ scenario, tariffs are set specifically to encourage
5
Design of Feed-in Tariffs for Great BritainFinal Report
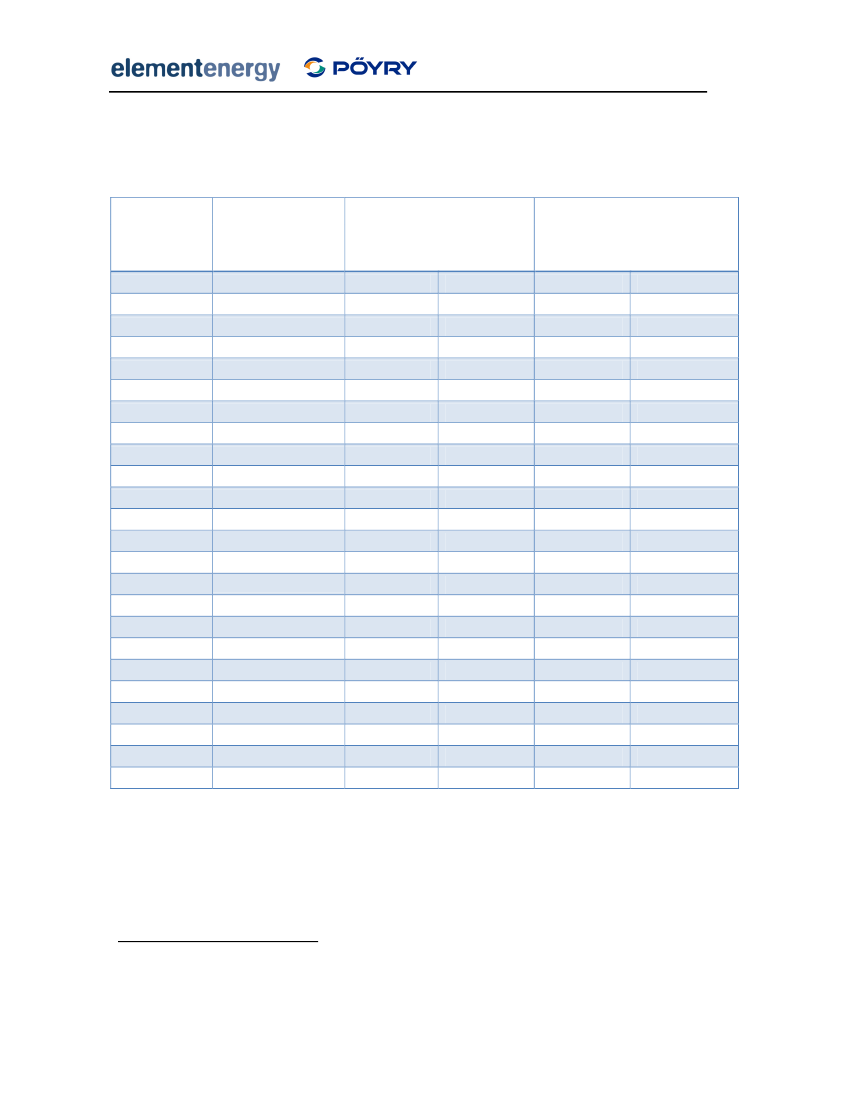
deployment of community- and domestic-scale technologies, such as small and medium windand PV systems.Table 1 Tariff levels for 2% diverse and community runs
2% diverse mixTechnologyPV
2% community bias
Wind
Hydro
WaveTidalBiomass
Waste
Initial tariff Degression2Initial tariffDegression (%Size(£/MWh)(% per year) (£/MWh)per year)Domestic£4005%£4005%4-10kW£3805%£3805%10-100kW£2505%£3505%100-5000kW£2505%£3005%Stand-alone£2505%£3005%Micro£2000%£3000%1-15kW£2000%£3000%15-50kW£2000%£2500%50-250kW£2000%£2000%250-500kW£2000%£1800%500-3000kW£1600%£1430%1-10kW£1450%£1450%10-50kW£1450%£1450%50-500kW£1450%£1400%500kW+£1400%£1400%All types£2502%£2502%All types£2500%£2500%Heat turbine£1300%£1300%ORC£1300%£1300%Steam turbine CHP£1300%£1300%Electricity only£00%£00%Electricity only£1000%£1000%AD£1000%£1000%Incineration£1000%£1000%
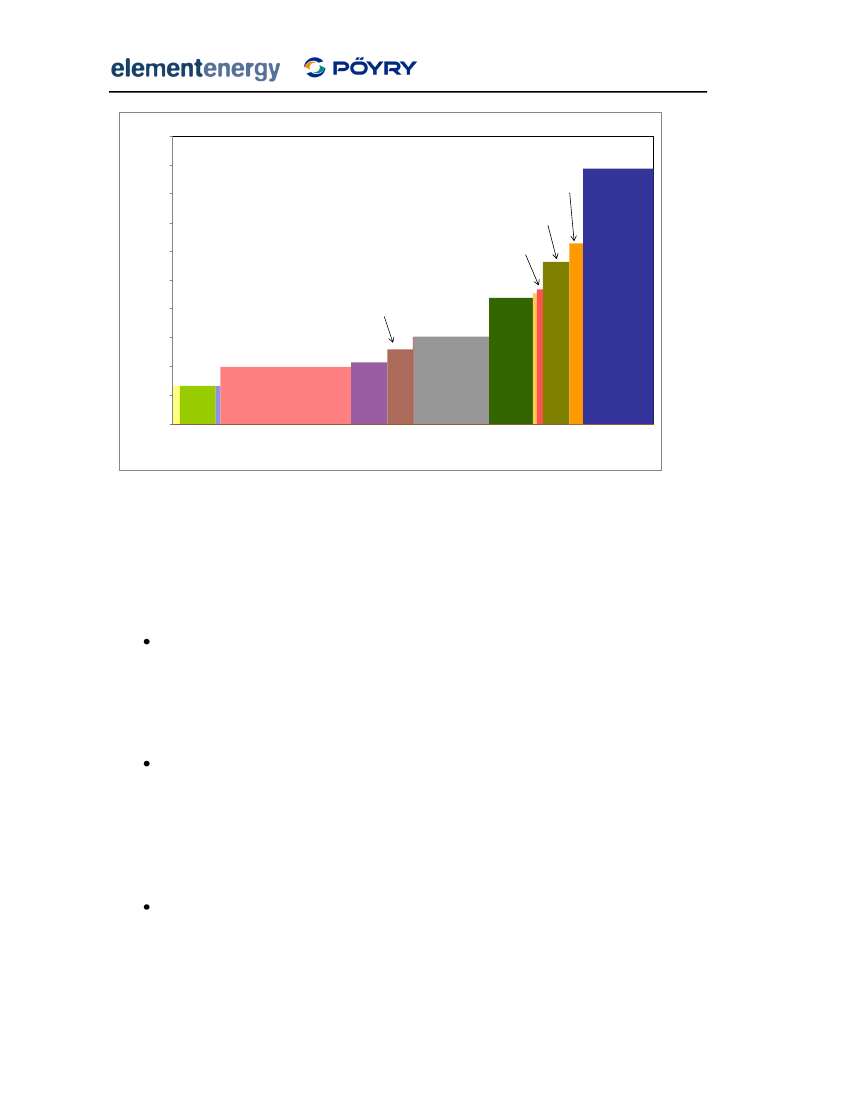
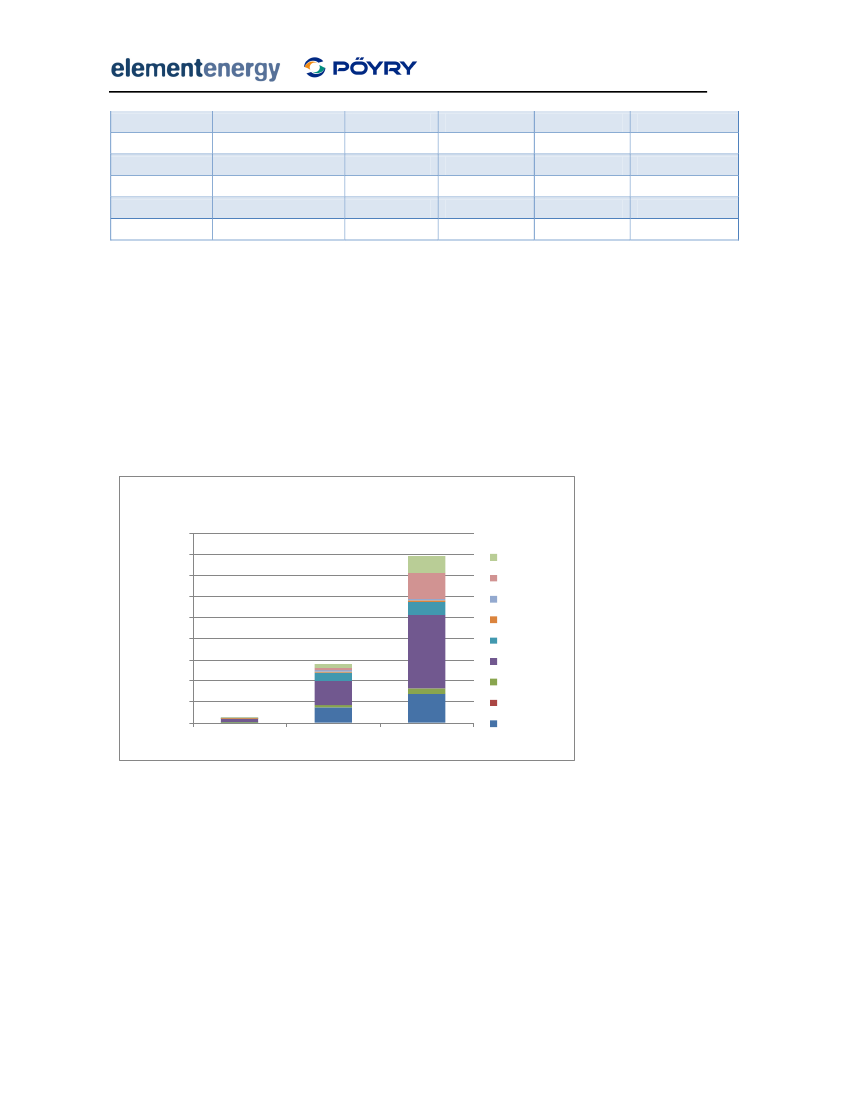
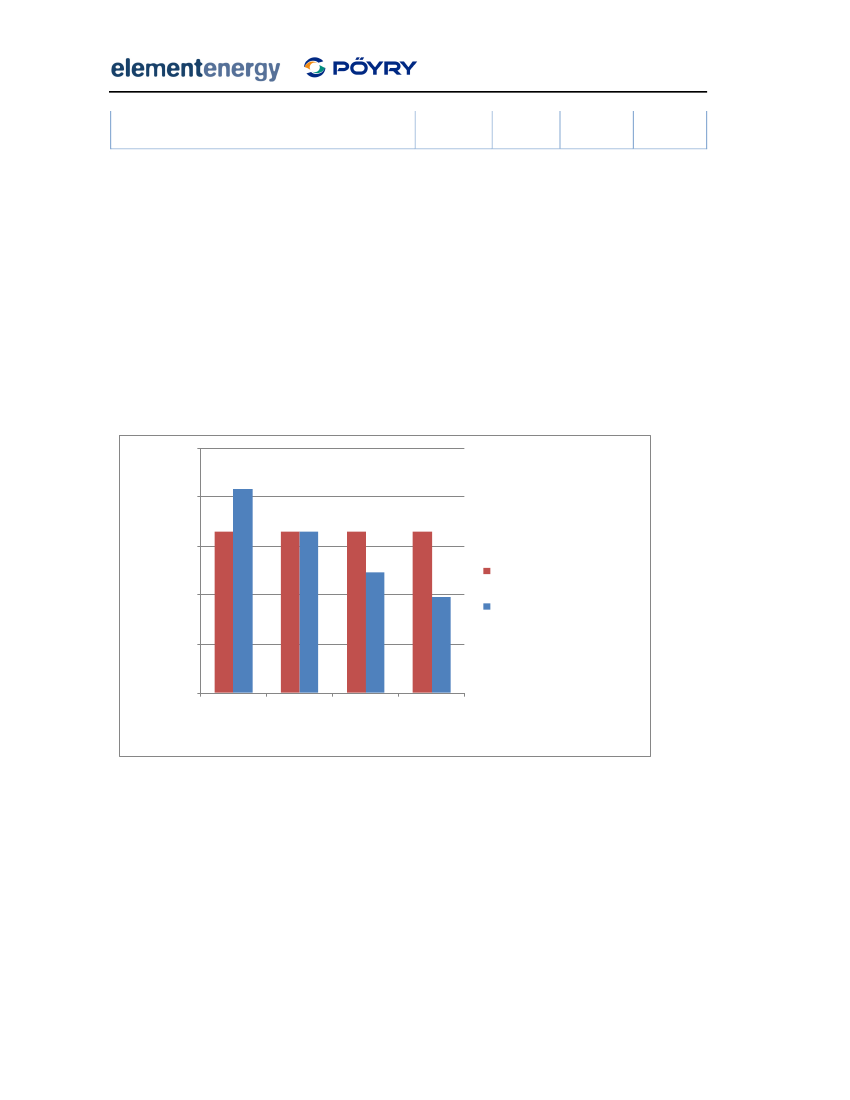
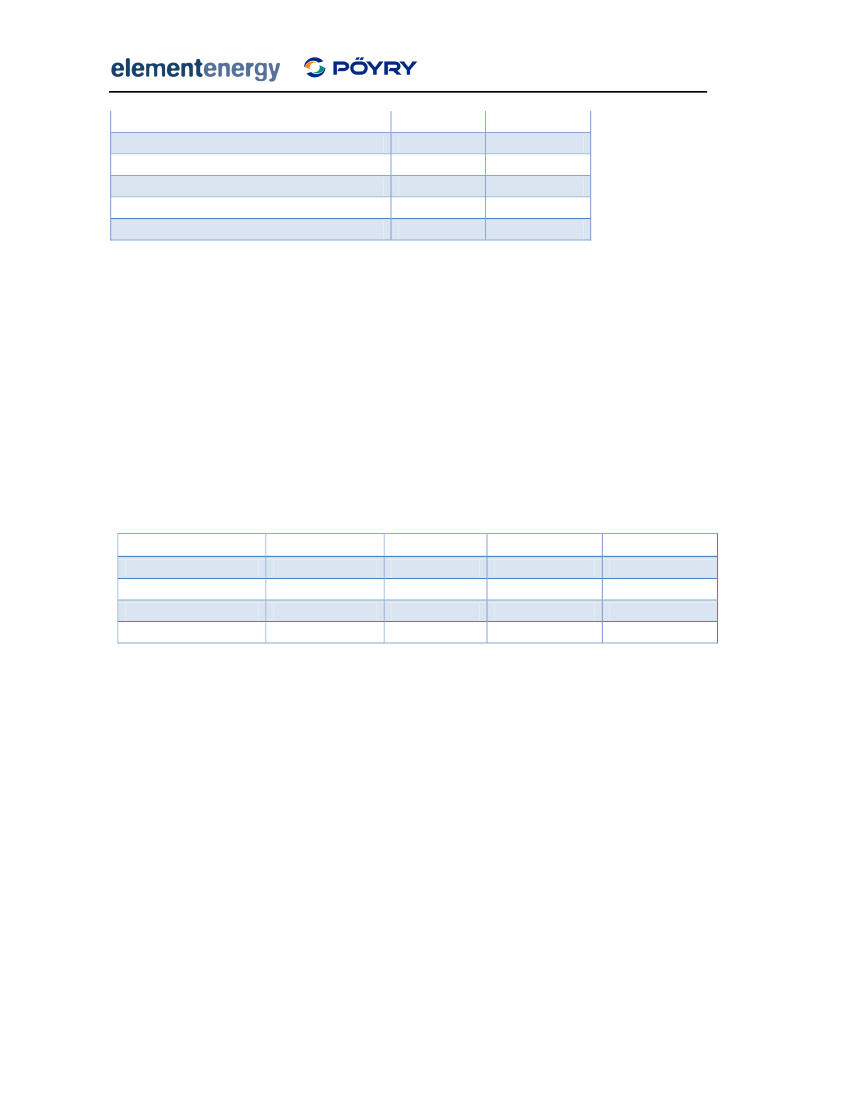
Figure 4 shows the electricity generation mix with the tariffs shown above. Although theoverall generation remains constant at 8TWh, the diversity of the generation mix issignificantly increased. In the ‘community-bias’ scenario, over 1.5TWh per year are generatedfrom PV, the majority of which is from domestic-scale installations. Small wind turbines up to250kW in size also contribute 0.5TWh in 2020. The costs of increasing technology diversity is2
The degression rate is the annual reduction in the tariff paid to new installations. The degression ratereflects anticipated reductions in technology costs and reduces overpayments to investors purchasingsystems in the future.
6
Design of Feed-in Tariffs for Great BritainFinal Report
high, with a cumulative resource cost (defined as the total money spent on capital equipmentand running costs for renewable energy plant) by 2020 of nearly £4 billion relative toBusiness as Usual, compared to £1.0 billion in the least cost scenario.
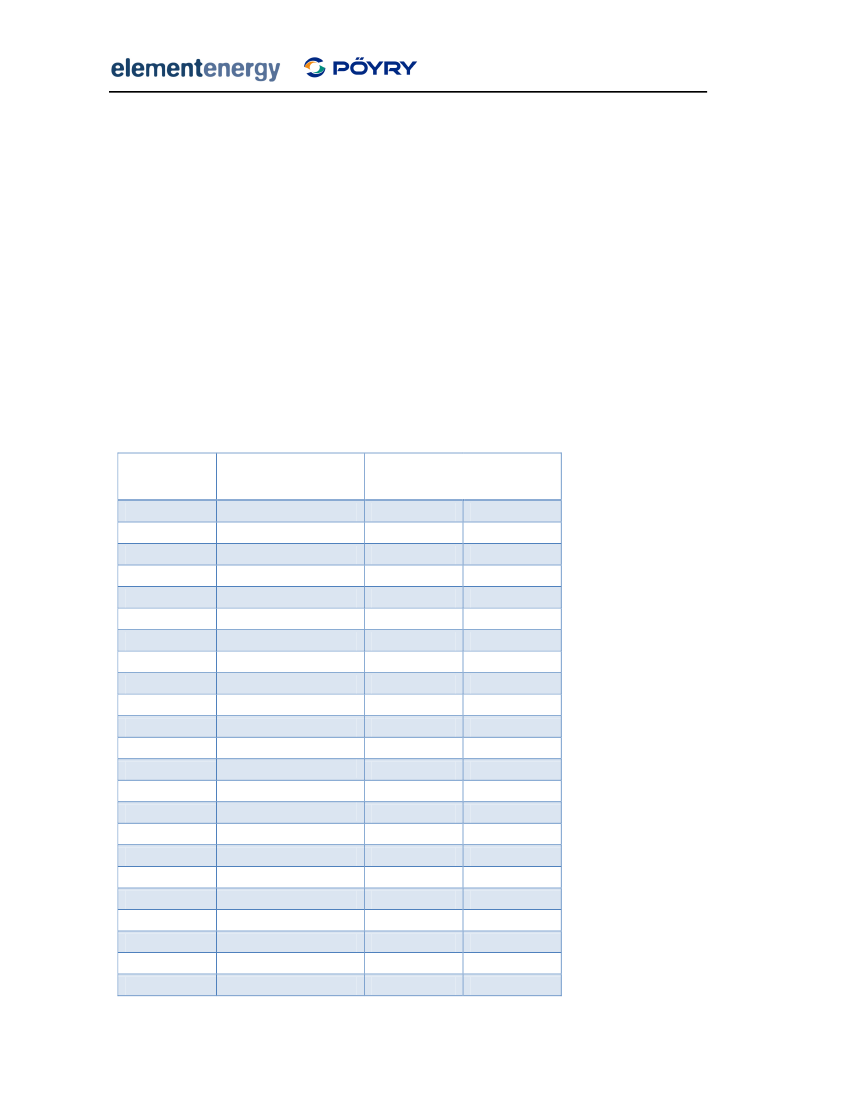
Electricity generation in 2020 - 2%scenarios9
Electricity generation in 2020 (TWh)
8765432102% least cost2% diverse2% community
WasteBio
TidalWaveHydroWind (Large)Wind (Small)PV (Large)PV (Small)
Figure 4 Renewable electricity generation in 2020 - diverse and community scenarios
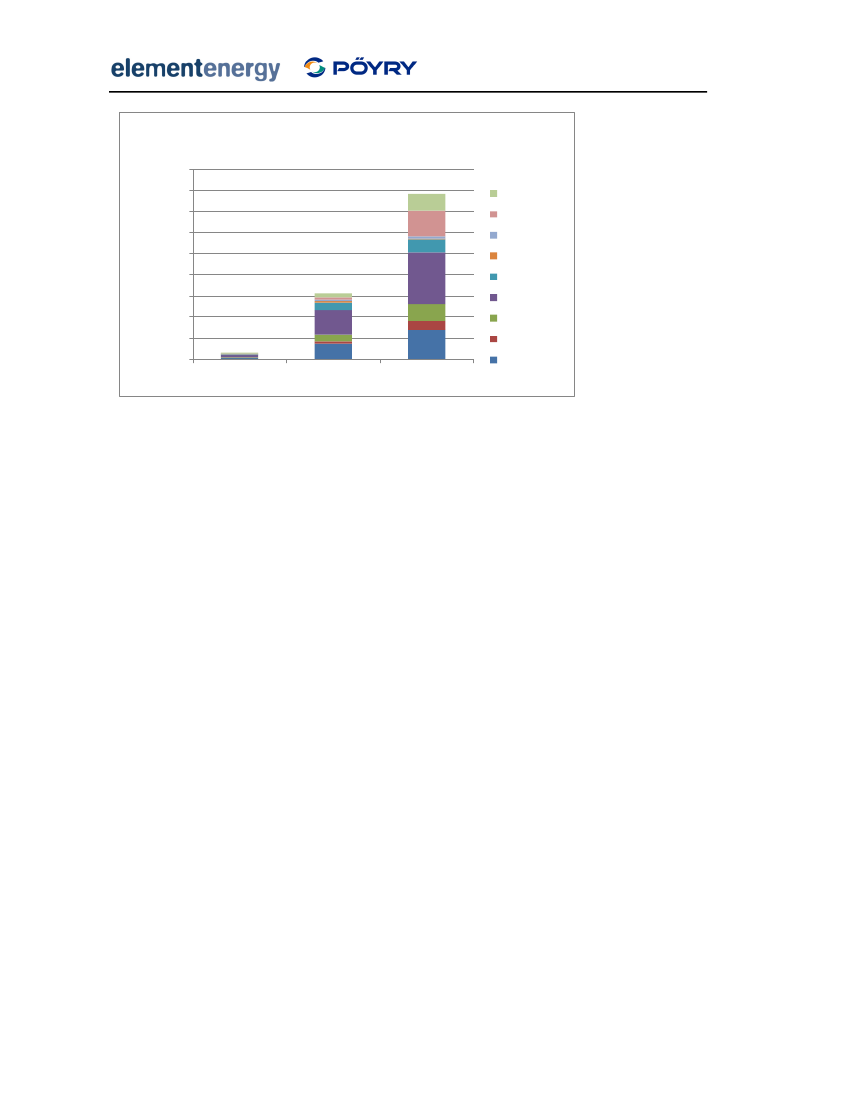
Figure 5 shows the supply curve for sub-5MW renewable electricity for the 2% ‘communityscenario. The width of each bar represents the amount of electricity generated by eachtechnology in 2020, while the height shows the levelised cost of energy in 2020 (in £ perMWh). Note that for simplicity, only the 2020 technology costs are shown. For technologieswhose costs decrease over time, some of the resource shown in Figure 5 is deployed earlierthan 2020 and so has a higher generating cost. All of the generation costs are calculatedusing a 10% cost of capital over the project lifetime. The figure shows that the wastetechnologies have the lowest cost of electricity, since plants earn revenue from heat salesand waste gate fees. Anaerobic digestion makes the largest contribution of the sub-5MWwaste technologies. There is nearly 6TWh of resource available in 2020 for a generating costof less than £150/MWh. There is then a significant gap between the generating costs ofbiomass CHP and small wind turbines while the levelised cost of domestic PV is still£450/MWh in 2020, at a 10% rate of return.
7
Design of Feed-in Tariffs for Great BritainFinal ReportSub-5MW renewable electricity supply curve - 2% Community scenario
£500£450
Domestic PVSmall PV
£400Technology cost in 2020 (£/MWh)
£350
Large PVWave /tidalSmallwindBiomassCHP
£300£250£200
MediumwindLargehydro
£150£100
Large windWaste
£50£0
1
2
Renewable Electricity Production in 2020 (TWh)
3
4
5
6
7
8
Figure 5 Renewable electricity supply curve - community bias
ConclusionsThe results above illustrate the overall costs of meeting a given generation target withdifferent technology mixes. The analysis also quantifies the effects of a range of other issuesrelevant to the design of Feed-in Tariffs. The key conclusions are summarised below:A 2% generation target can be achieved at relatively low cost using mega-watt scaletechnologies. The cumulative resource cost by 2020 is £1.0 billion higher thanbusiness as usual. Diversifying the technology mix to include domestic-scale PV andwind comes at a high cost, with the cumulative resource cost in 2020 increasing to £4billion.Banding tariffs by technology can lead to significant reductions in subsidy costs whilemaintaining the same overall generation by reducing overpayments to low-costgenerators. The importance of banding increases with increasing technologydiversity, since the differences in costs between technologies becomes larger thandifferences within technologies (for example large wind turbines at different wind-speed sites).Increasing the generation target to 3.5% of the UK electricity demand significantlyincreases the cost to the country by 2020, from £1 billion to £4 billion for the leastcost scenarios. A 3.5% least cost scenario results in significant uptake of small-scaletechnologies, with over 3TWh of electricity per year generated from PV and small8
Design of Feed-in Tariffs for Great BritainFinal Report
wind. This is because for ambitious targets, large-scale technologies cannot bedeployed quickly enough to meet the target by 2020.For technologies whose costs are expected to decrease over time, reducing tarifflevels each year is necessary to avoid overpayments to investors making investmentsin the second half of the next decade. However, matching tariff levels to technologycosts from the first year of the policy results in significantly higher policy costs thansetting a flat tariff so that the technology is only deployed when its costs decrease. Inother words, there is a financial benefit to delaying uptake until technologies arecheaper. The risk of this approach is that if investor demand is low for the first fewyears of the policy because the tariffs are not sufficiently generous, the industry willnot make the investments necessary to deliver large amounts of renewable energy atlow cost towards 2020.Premium tariffs, where tariff payments are made on top of the market electricityprice, carry a higher risk than a fixed tariff with an equivalent total support level, dueto volatility of electricity prices3. This additional risk is likely to be reflected in ahigher cost of capital for projects and higher hurdle rates. This means that overallsupport must be higher under a premium tariff to encourage a given level of uptake.In the results above, it is assumed that tariffs are paid over the lifetime of thetechnology. Where investors employ high discount rates and place a low financialvalue on revenues received in the distant future, total subsidy costs can besignificantly reduced by paying tariffs over a shorter period. For example, for aninvestor with a 10% discount rate, a 10 year tariff that provides the same perceivedvalue as a 25 year tariff has a 25% lower lifetime subsidy cost (assessed at the socialdiscount rate of 3.5%).The benefit of paying tariffs over a shorter period is highly sensitive to the way inwhich investors value long term benefits. For an early adopter with a similar discountrate to the social discount rate, there is no benefit to paying tariffs over a shorterperiod. For investors with very high discount rates, such as many domesticconsumers, costs can be reduced by paying tariffs up-front at the point of purchase(capitalisation). The risk of this approach is that the investor has less incentive tocontinue to operate the system after the majority of the tariff has been paid. Inaddition, capitalisation requires the energy output of each system to be ‘deemed’(estimated), and would require additional verification that the device actuallydelivered the electricity that it was predicted to generate.3
In addition to exposing investors to variability in market electricity prices, premium tariff designs alsorequire that generators participate in the grid balancing and settlement processes. This can reduce thecosts to the grid operator of large amounts of intermittent renewable generating capacity, but thetransaction costs can be high for small generators. A detailed assessment of fixed and premium tariffsis provided in the companion report on Qualitative Design Issues.
9
Design of Feed-in Tariffs for Great BritainFinal Report
Tariff designs based on setting tariffs to fulfil a certain policy objective risk ‘pickingwinners’, because the uptake of individual technologies is very sensitive to the tarifflevel. For example, in designing a tariff to deliver a significant quantity of renewableelectricity from small-scale PV, the government must ‘choose’ to support thistechnology relative to other, less costly alternatives. A more transparent method ofsetting tariffs is to provide an equal rate of return to all technologies.Setting tariffs to provide an 8% rate of return for all technologies encourages uptakeof small-scale, higher cost technologies but does not stimulate deployment of large-scale systems. This is because there is a significant proportion of domestic investorswho are willing to accept returns of 8% or less, but the majority of large-scaleinvestors have hurdle rates above 8%.The treatment of electricity from biomass must be considered carefully in the designof the Feed-in Tariff. A tariff structure that fails to provide additional incentives forplants utilising waste heat is likely to encourage the construction of electricity-onlyplants. This is an inefficient use of biomass compared to CHP plants and co-firing ingigawatt-scale electricity plants.A heat incentive of £10/MWhth, similar to the additional 0.5 ROCs per MWhepaid toCHP plants under the RO, is sufficient to encourage use of waste heat in on-siteapplications. However, higher support is required to encourage deployment of plantsconnected to district heating networks due to the high additional costs involved. Thishigher support could be provided through the Feed-in Tariff, the Renewable HeatIncentive, or other policy support such as low-cost finance or grants for theconstruction of the heat distribution networks.There is a very large potential for gas-fired CHP available at relatively low cost. A flattariff of £155/MWh, equivalent to the market electricity price plus the 2 ROCs perMWh currently paid to renewable microgenerators, delivers nearly 22TWh of CHPelectricity by 2020. The annual CO2savings from gas-fired CHP in that year are over 3million tonnes. However, the majority of this potential is from domestic-scale deviceswhich are not currently available in commercial quantities. As a result there is someuncertainty over the long term costs of these technologies.A flat tariff of £155/MWh for gas-fired CHP has significantly lower subsidy costs thanan initial tariff of £240/MWh degressed at 5% per year. This is because uptake isinitially constrained by the ability of the industry to ramp up production capacity.Paying higher initial tariffs results in overpayments to investors who were willing toinvest with lower support levels, while failing to deliver any additional deployment.This supports holding tariffs at the same level for the first few years of the policy,before introducing degression to match any further cost reductions.
10
Design of Feed-in Tariffs for Great BritainFinal Report
Contents123Executive Summary ............................................................................................................. 2Introduction ...................................................................................................................... 15Methodology ..................................................................................................................... 173.1Overview of model methodology.............................................................................. 17Technologies considered ................................................................................... 19
3.1.13.23.33.4
Investor behaviour .................................................................................................... 20Assessment of resource potentials ........................................................................... 22Barriers to uptake...................................................................................................... 25Social acceptance .............................................................................................. 25Market barriers ................................................................................................. 26Growth rate constraints .................................................................................... 27
3.4.13.4.23.4.33.53.63.7
Model Calibration...................................................................................................... 28Fuel prices ................................................................................................................. 30Model outputs ........................................................................................................... 32Additional electricity and heat generation ....................................................... 32Resource costs ................................................................................................... 33Costs to consumers ........................................................................................... 33Annual CO2savings ............................................................................................ 34
3.7.13.7.23.7.33.7.44
Baseline ............................................................................................................................. 354.1.14.1.2Baseline assumptions ........................................................................................ 35Baseline results.................................................................................................. 36
5
Results and analysis........................................................................................................... 3911
Design of Feed-in Tariffs for Great BritainFinal Report
5.1
2% target ................................................................................................................... 40Flat tariffs .......................................................................................................... 40Tariff banding .................................................................................................... 42Least cost scenarios........................................................................................... 43Enhancing technology diversity ........................................................................ 44
5.1.15.1.25.1.35.1.45.2
3.5% target ................................................................................................................ 50Flat tariff ............................................................................................................ 50Least cost tariff .................................................................................................. 51Diverse and community scenarios .................................................................... 52
5.2.15.2.25.2.35.35.45.55.65.75.867
Degressed tariffs ....................................................................................................... 56Premium tariffs ......................................................................................................... 59Effect of tariff lifetime ............................................................................................... 63Tariffs based on rate of return .................................................................................. 66Interaction between the feed-in tariffs and the Renewable Heat Incentive ............ 70Gas-fired CHP ............................................................................................................ 73
Conclusions ....................................................................................................................... 77Appendix A - Technology cost and performance assumptions ......................................... 807.17.27.37.47.57.67.7PV .............................................................................................................................. 83Wind .......................................................................................................................... 85Hydro power.............................................................................................................. 89Wave power .............................................................................................................. 91Tidal power................................................................................................................ 93Biomass CHP .............................................................................................................. 94Gas CHP ..................................................................................................................... 96
8
Appendix B – Estimation of the potential for sub-5MW renewable electricity. ............... 98
12
Design of Feed-in Tariffs for Great BritainFinal Report
8.1.18.1.28.1.38.1.48.1.58.1.68.1.78.1.8
Photovoltaics ..................................................................................................... 98Wind ................................................................................................................ 100Hydro power.................................................................................................... 104Wave power .................................................................................................... 105Tidal power ...................................................................................................... 106Biomass ........................................................................................................... 107Waste .............................................................................................................. 111Gas CHP ........................................................................................................... 112
13
Design of Feed-in Tariffs for Great BritainFinal Report
DisclaimerWhile Pöyry Energy (Oxford) Ltd (“Pöyry”) and Element Energy Limited (“Element”) considerthat the information and opinions given in this work are sound, all parties must rely upontheir own skill and judgement when making use of it. Neither Pöyry nor Element make anyrepresentation or warranty, expressed or implied, as to the accuracy or completeness of theinformation contained in this report and assumes no responsibility for the accuracy orcompleteness of such information. Neither Pöyry nor Element will assume any liability toanyone for any loss or damage arising out of the provision of this report.The report contains projections that are based on assumptions that are subject touncertainties and contingencies. Because of the subjective judgements and inherentuncertainties of projections, and because events frequently do not occur as expected, therecan be no assurance that the projections contained herein will be realised and actual resultsmay be different from projected results. Hence the projections supplied are not to beregarded as firm predictions of the future, but rather as illustrations of what might happen.Parties are advised to base their actions on an awareness of the range of such projections,and to note that the range necessarily broadens in the latter years of the projections.Contact details:Element EnergyAlex Stewart (Consultant)Twenty Station RoadCambridgeCB1 2JD01223 227533[email protected]Ben Madden (Director)60 Newman StreetLondonW1T 3DA[email protected]
14
Design of Feed-in Tariffs for Great BritainFinal Report
2 IntroductionThe EU Renewable Energy Directive 2008 sets an ambitious target that 20% of energy used inthe EU in 2020 should come from renewable sources. This target applies to all energy usesincluding electricity, heat and transport. The Directive sets out individual targets for eachmember state, and the UK must derive 15% of its final energy consumption from renewablesources. The Energy Strategy will set out how the UK Government intends to meet this targetover the next ten years. In the RES consultation published in 2008, the Government indicatedthat renewable electricity would make a major contribution to the overall target, with 30-35% of electricity being renewable in 2020. While the majority of this increase will be fromlarge-scale technologies such as onshore and offshore wind delivered through theRenewables Obligation, it is expected that a contribution from smaller-scale technologies willbe required if the overall target is to be met.The Energy Act 2008 gives the Government powers to introduce Feed-in Tariffs for small-scale generators with capacities under 5MWe. Feed-in Tariffs will apply to a wide range oftechnologies, from domestic-scale solar photovoltaics and wind systems through tomegawatt scale wind turbines and biomass electricity plants. Feed-in Tariffs are widely usedto promote renewable electricity in continental Europe, and have led to widespreaddeployment of higher-cost technologies such as photovoltaics that have not been deliveredin large numbers under the UK’s Renewable Obligation. While all Feed-in Tariff schemesshare common features, such as guaranteed payments for eligible generators andguaranteed grid access, the detailed design and implementation of the policies differmarkedly between member states. For example, in some schemes generators receive fixedtariffs for generated electricity that are independent of the market electricity price, while inother schemes generators are required to participate in the electricity market in the sameway that large fossil fuel plants do.Element Energy and Pöyry were commissioned in early 2009 to conduct a detailed reviewand analysis of Feed-in Tariff schemes across the EU to inform the design of the Feed-in Tariffthat will be implemented in England, Scotland and Wales in April 2010. The work was splitinto two parallel streams. The first stream was an exhaustive qualitative review of Feed-inTariff design parameters, drawing on experience of best-practice from existing schemes. Thatreport is published by Pöyry and Element Energy alongside this one. The second stream is aquantitative analysis of the optimal design of Feed-in Tariffs for Great Britain. This was basedon the development of a model of the potential for sub-5MW renewable electricity in GreatBritain, which can be used to investigate technology uptake under different Feed-in Tariffdesigns.The modelling approach, described in detail in Section 3, is based on the construction ofrenewable electricity supply curves showing the size of the resource available at a given15
Design of Feed-in Tariffs for Great BritainFinal Report
generating cost. The resource potentials for each technology were estimated using acombination of industry consultation, literature review and primary analysis usingGeographical Information Systems (GIS). The resource potentials were combined with atechnology cost and performance model and a representation of investor behaviour basedon telephone discussions with renewable energy investors. The resulting model is able toproject uptake of each renewable technology under a wide range of feed-in tariff designs.These range from relatively simple designs that aim to minimise the costs to the economyand electricity consumers for a given electricity generation target, to more complexapproaches based on encouraging a wide range of technologies and scales or offering equalrates of return to all investors. Many design issues discussed in the qualitative report, such asthe effects of premium versus fixed tariffs and degression, can be investigated and quantifiedusing the model.
16
Design of Feed-in Tariffs for Great BritainFinal Report
3 Methodology3.1 Overview of model methodologyThis section describes the modelling approach employed to investigate the effect of differentFeed-in Tariff designs on the uptake of sub-5MW renewable electricity. The overall approachbuilds on previous Element Energy analysis of the potential for medium-scale wind and PV inthe commercial buildings sector4, and is based on the construction of renewable energysupply curves, which show the cost of electricity and potential resource for each technology(see Figure 6). This is similar to the approach employed by Green-X, which modelled uptakeof renewable electricity technologies under Feed-in Tariffs and tradable green certificateschemes in the EU5.
Figure 6 Illustrative renewable energy supply curve
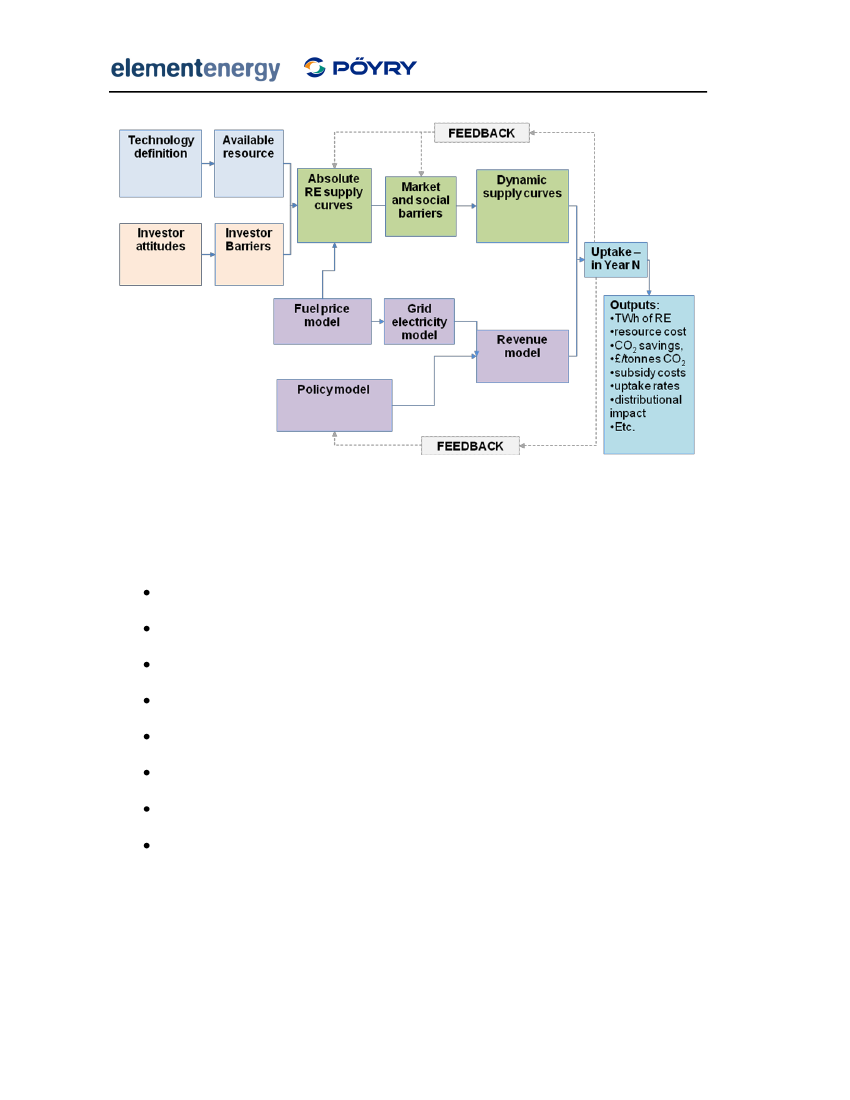
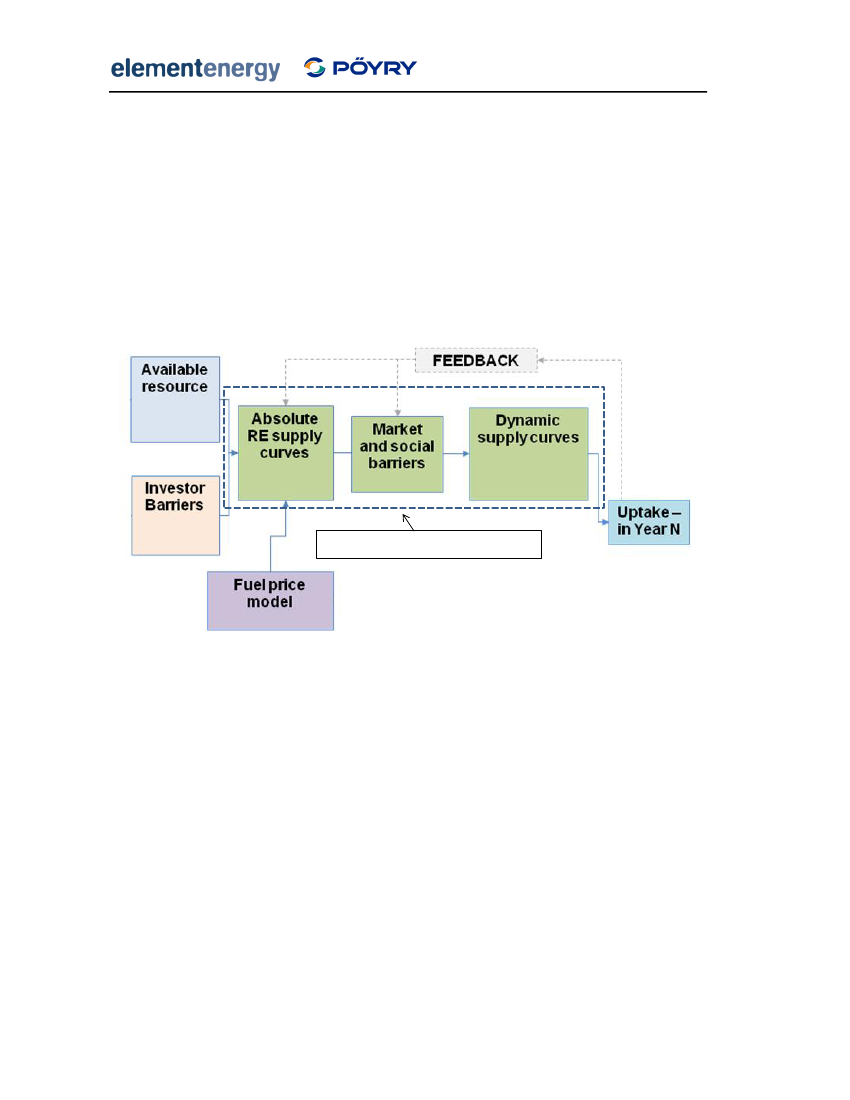
The overall model structure is shown in Figure 7. Absolute supply curves are derived for eachtechnology by combining cost data and a model of investor behaviour with the assessment ofthe technical potential described in Section 3.3. The absolute supply curves show themaximum quantity of renewable technology that can be deployed at a given generation cost;they do not include any demand or supply-side constraints. These market and social barriersare then applied to the absolute supply curve to yield dynamic supply curves, which show themaximum deployment for each technology in a given year.The renewable electricity technologies on the supply curve are disaggregated according tothe following attributes:4
Element Energy (2008): The Growth Potential for On-site Renewable Electricity in the Non-domesticSector.5Green-X (2004) – Deriving optimal promotion strategies for increasing the share of renewableelectricity in a dynamic European electricity market.
17
Design of Feed-in Tariffs for Great BritainFinal Report
Technology type - e.g. PV or windTechnology scale - e.g. building mounted, small and large windSite type - e.g. wind-speed, heat load, insolation levelInvestor - e.g. householder or utility. The investor type affects the cost of capital andhence the overall project costs.Year - this influences the technology costs and the maximum deployment in thatyear.Once the dynamic supply curves have been established, a revenue model is used to calculatethe total income per megawatt-hour for each technology. The revenue model includes themarket value of electricity and heat, as well as payments made from Feed-in Tariffs. If thetotal revenue exceeds the generating costs for a given technology and investors, thepotential of that technology in that year is deployed. The model reports uptake in terms ofnumbers of installations, electricity generation and installed capacity for each technology andyear. It also reports net costs and benefits to the country in line with Government guidelineson appraising low carbon policies.Feedbacks are implemented at several stages in the model. The market and social barriersused to build the dynamic supply curves for each year depend on the cumulative uptake ofeach technology. For example, the amount of PV that can be deployed in each year dependson the sales in the last year since the industry has a finite growth rate. In addition, tarifflevels paid to generators under the FIT can be linked to uptake, so that tariffs are reduced ifuptake in the last year exceeded a set value. This is implemented in Germany, where tariffsare ‘degressed’ by an additional 1% over the standard reduction last year’s installed capacityexceeded a pre-defined value.
18
Design of Feed-in Tariffs for Great BritainFinal Report
Figure 7 Overview of model structure
3.1.1
Technologies considered
Following discussions with DECC, the following technologies were considered in the model:PhotovoltaicsOnshore windHydroelectric powerWave powerTidal powerBiomass CHPWaste to energy technologiesGas-fired CHP (up to 50kWe)In line with the capacity limit for the Feed-in Tariff described in the Energy Act 2008, onlysub-5MWeprojects considered. Some of the technologies considered, such as incineration,are traditionally sized higher than 5MWedue to economies of scale. Where this was the case,only sub-5MW plants were included in the model, and the total resource was restricted tosites suitable for smaller plants (see Section 3.3).
19
Design of Feed-in Tariffs for Great BritainFinal Report
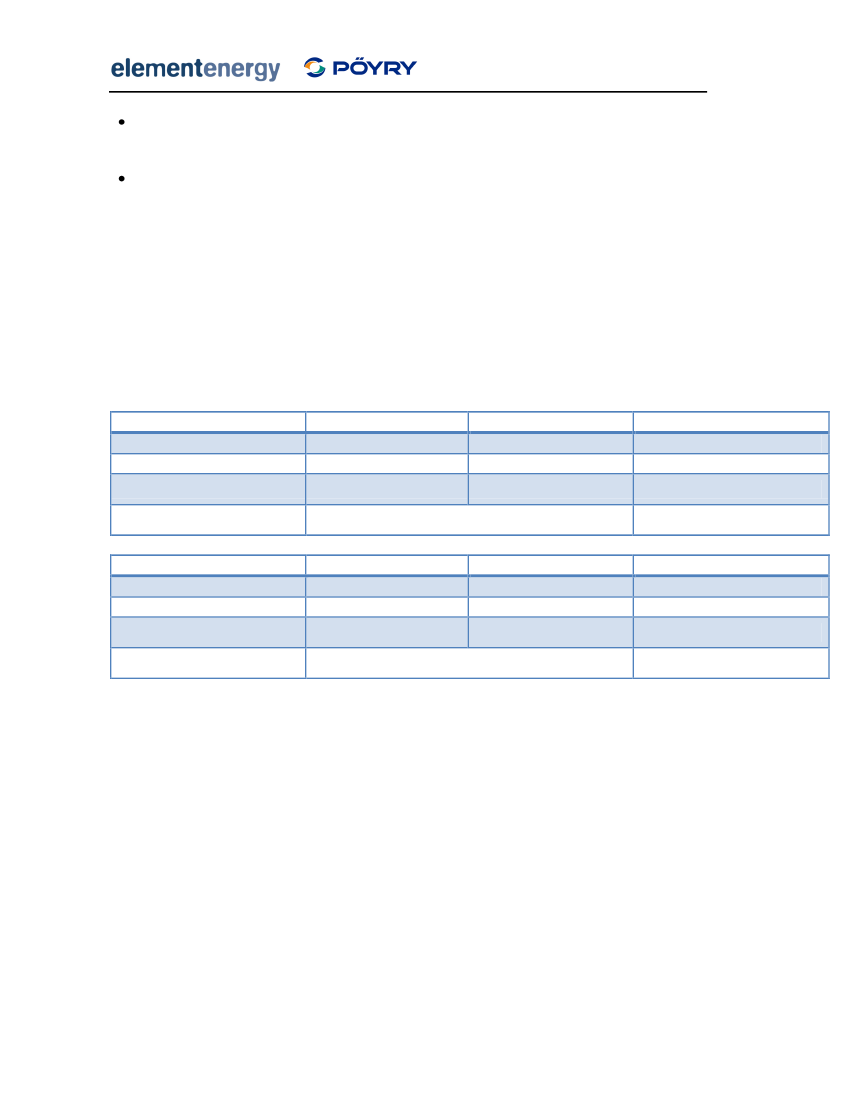
3.2 Investor behaviourThe uptake of renewable electricity technologies under a supportive Feed-in Tariff dependson whether or not the rate of return of the project exceeds the hurdle rate of potentialinvestors. The hurdle rate of large-scale investors is based on their Weighted Average Cost ofCapital (WACC), which is itself dependent on the risk associated with the project. This meansthat projects employing novel technologies, such as marine power or advanced thermaltreatment of waste, will have higher hurdle rates than those using established technologies,to reflect the risk of technology failure.The hurdle rates assumed for large-scale investors are based on telephone discussions with anumber of investors conducted by Pöyry in early 2009. Detailed results of these discussionsare included in the report by Element and Pöyry on qualitative design issues thataccompanies this report. Table 2 summarises the hurdle rates by investor and technologyfrom the discussions. In general utility companies have lower hurdle rates than developersdo for similar projects, and rates for novel high risk technologies are two to four percentagepoints higher for novel, higher risk technologies. The values in Table 2 show the maximumhurdle rates for each technology. To represent the range of hurdle rates observed in thewhole population, a distribution of hurdle rates was implemented. Large-scale investors areassumed to have a minimum hurdle rate of 8%, regardless of technology, and the maximumvalues shown below. The figures below are post-tax nominal hurdle rates.Table 2 Hurdle rates for large scale investors
Utility/ESCO
Developer
Large scale Medium scale Large scaleSolar PVOnshore WindHydroBiomassWaveTidalWaste ADGasificationIncineration8%8%8%10%12%12%8%12%8%10%12%12%12%10%10%10%12%14%14%10%14%10%
20
Design of Feed-in Tariffs for Great BritainFinal Report
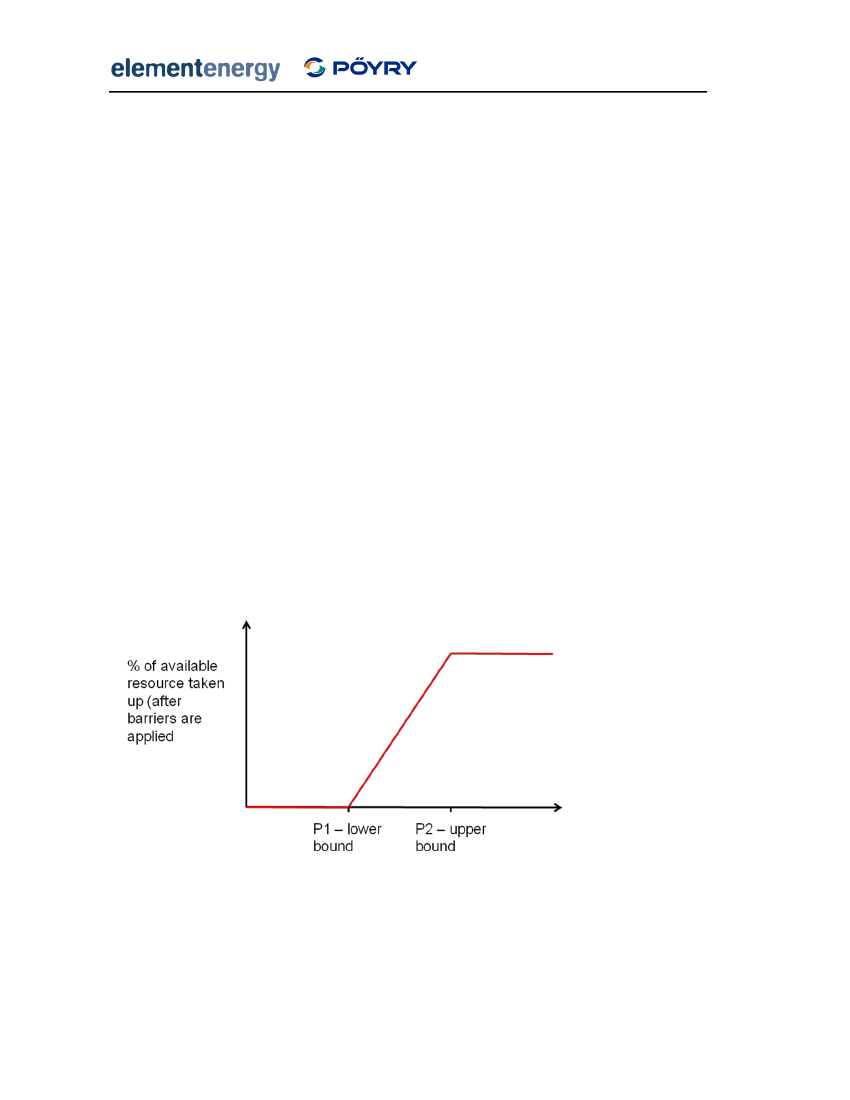
Smaller-scale investors such as householders and commercial building do not use a singlehurdle rate when assessing investment decisions. Instead, the effective hurdle rate of aproject includes a number of intangible factors such as hassle costs and transaction costs,which vary significantly between investors. For example, literature on uptake of energyefficiency measures suggests that many domestic consumers have very high hurdle rates,expecting returns of 20% per year, while early adopters invest in technologies which do notprovide positive returns in their lifetimes. To represent this range of consumer behaviour, adistribution of hurdle rates was implemented in the model. At the domestic scale, theminimum hurdle rate was assumed to be 3%, close to the social discount rate of 3.5%, andthe maximum was 20%. Commercial building owners are assumed to have a narrowerdistribution, with minimum and maximum hurdle rates of 6% and 15% respectively. Therange of hurdle rates is significantly higher than for large-scale investors described above.For both large and small-scale consumers, hurdle rates are distributed linearly through thepopulation, as shown in Figure 8. In the figure, P1 and P2 represent the levelised technologycosts when assessed at the minimum and maximum hurdle rates. If the total revenuethrough the feed-in tariff is lower than P1, no uptake occurs. If the revenue is half waybetween P1 and P2, 50% of the potential in the dynamic supply curve is deployed. Ifrevenues are higher than the levelised cost when assessed at the maximum hurdle rate,100% of the maximum annual potential is deployed. This implies that increasing revenuesbeyond these values does not increase technology uptake, but increases producer profits andthe total subsidy spend.
Figure 8 Distribution of investor behaviour in the model
21
Design of Feed-in Tariffs for Great BritainFinal Report
3.3 Assessment of resource potentialsThe total technical resource was estimated for each of the technologies considered in themodel. The technical potential represents the upper bound for the amount of a technologythat can be deployed if sufficient policy and financial support were provided. The technicalpotential does not include time-dependent constraints such as the maximum growth rate ofthe industry or a limit on investor demand in a given year; these constraints are imposed onthe absolute supply curves to give dynamic supply curves, which show the resource availablein a given year.
Development of supply curves
Figure 9 Steps used in the development of dynamic supply curves
The factors constraining the absolute resource potentials are technology-specific. Forexample, the potential for building-attached photovoltaics is constrained by the amount ofavailable roof space in the commercial and domestic sectors. On-shore wind power isconstrained by the availability of high wind-speed sites, as well as by the strength of the localelectricity grid and the proximity of buildings. For technologies using a finite feed-stock, suchas biomass or waste, the availability of the feed-stock often constrains the overalldeployment. For example, anaerobic digestion has a specific requirement for biologicalwaste, and ‘competes’ with other disposal methods such as advanced thermal treatment andcomposting for that resource. It should be noted that although the supply of domesticallygrown biomass is limited due to land availability, the UK can import large quantities ofbiomass from overseas. For the purposes of this study, it is assumed that the availability ofbiomass is not a constraint on the potential for sub-5MW systems.
22
Design of Feed-in Tariffs for Great BritainFinal Report
The 5MW capacity cap under the UK Feed-in Tariff makes the estimation of resourcepotentials for several technologies challenging. For example, wave and tidal technologies arelikely to be deployed in clusters with total capacities exceeding 5MWe, due to prohibitivecosts of grid connection and maintenance for sites far from the shore. Therefore, ourassessment of the sub-5MW marine resource excludes sites in deep water that are far fromthe coast, and only near-shore sites appropriate for smaller projects are included. Themethodologies used to estimate the resource potentials for each technology are described indetail in Appendix B.Table 3 summarises the technical potentials for sub-5MW renewable electricity in the UK. Interms of absolute potential, PV has the highest potential of the renewable technologies withover 60TWh per year. The potential for biomass electricity is over 40TWh a year, even whenconstrained by heat demands. The potential for gas-fired CHP is extremely large, equivalentto over 25% of UK electricity demand. The majority of this is in the domestic sector, andassumes that a technology such as fuel cell CHP is commercialised that allows high run hoursin sites with relatively low heat demands, such as new homes.
23
Design of Feed-in Tariffs for Great BritainFinal Report
Table 3 Summary of resource potentials for sub-5MW electricity in the UK.
TechnologyPV
Wind
Hydro
TypeDomesticMedium/large building attachedStand-aloneMicro1.5-15kW15-50kW50-250kW250-500kW500-3000kW1-100kW100-1000kW1000+ kWSub-5MWSub-5MWDistrict heating - new buildDistrict heating - retrofitStand-alone commercialLow temperature industrialAdvanced Thermal TreatmentAnaerobic DigestionIncinerationDomestic 1kW1-50kWTotal renewableTotal including gas CHP
Technical potential (TWh/year)22.329.68.53.81.11.41.51.68.40.53.01.30.40.21.517.06.018.80.73.30.588.723.8131.2243.7
WaveTidalBiomass
Waste
Gas CHP
24
Design of Feed-in Tariffs for Great BritainFinal Report
3.4 Barriers to uptakeAs shown above, the technical potential is extremely large for the majority of renewableenergy technologies. However, there are numerous barriers that restrict the amount ofrenewable energy that can be deployed in a given year. There are three barriers within themodel that are used to generate dynamic supply curves for each year from the staticresource potentials.
3.4.1
Social acceptance
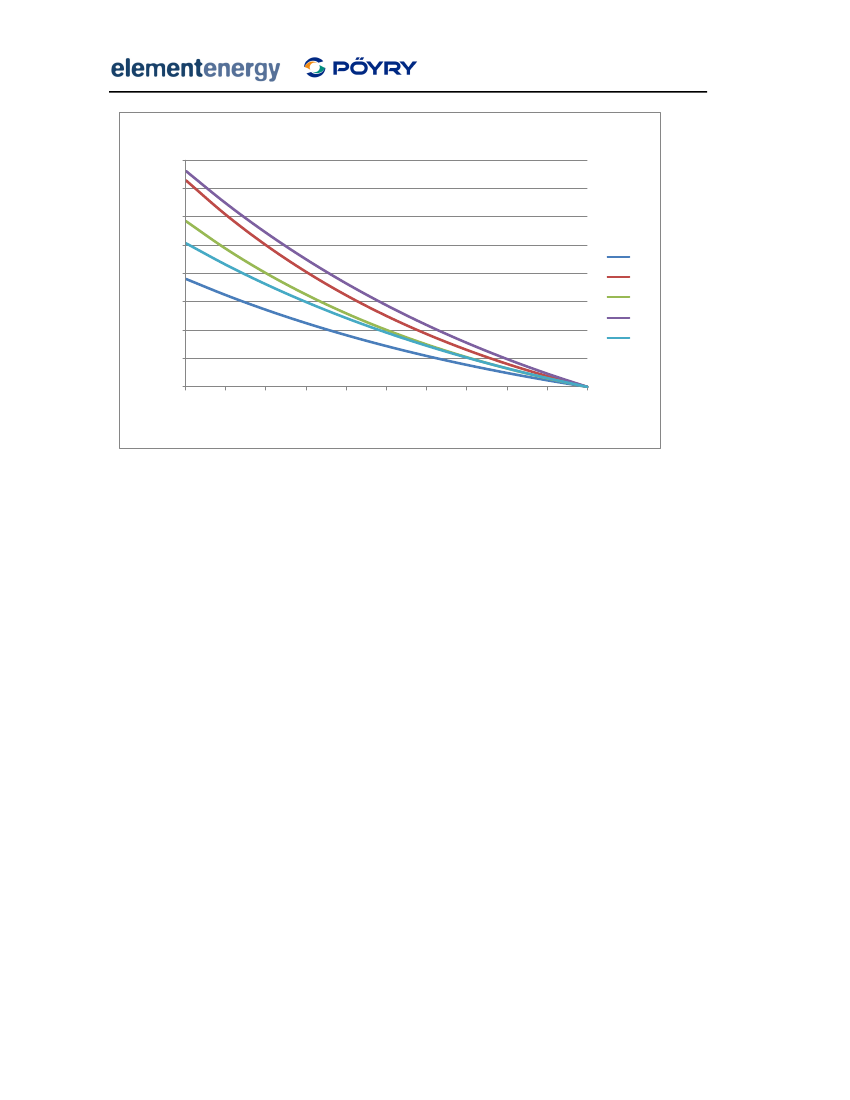
For many renewable energy technologies, social acceptance is a key factor determining themaximum deployment. This is especially true for large scale technologies such as on-shorewind and waste, where there can be strong public opposition due to concerns over visualimpact, noise, traffic movements or air quality. The social acceptance of these technologiestends to decrease with increasing deployment, for example as concerns grow with thecumulative impact on the landscape of a large number of wind farms. In addition, developersare likely to exploit sites with smaller anticipated planning issues first, so new deploymentover time occurs in more and more ‘difficult’ sites. For novel technologies with lowcumulative deployments, however, social acceptance is likely to increase at first as the publicfamiliarity increases and misconceptions are overcome. Figure 10 shows the socialacceptance barriers implemented in the model. The percentage of the remaining potentialthat can be deployed in a given is assumed to decrease exponentially with the percentage ofabsolute potential achieved. To reflect the increasing social acceptance of novel technologieswith low deployments, the starting point of the function is set sufficiently high that it is lessrestrictive than supply side barriers.
25
Design of Feed-in Tariffs for Great BritainFinal Report
Social barriers% of additional potential available in each year
0.40.350.3
0.25bS10.20.150.10.05000.10.20.30.40.50.60.70.80.91bS2bS3bS4bS5
Achievement of absolute potential
Figure 10 Social acceptance barriers employed in the model. bS1 – bS5 represent different levels of socialbarriers.
3.4.2
Market barriers
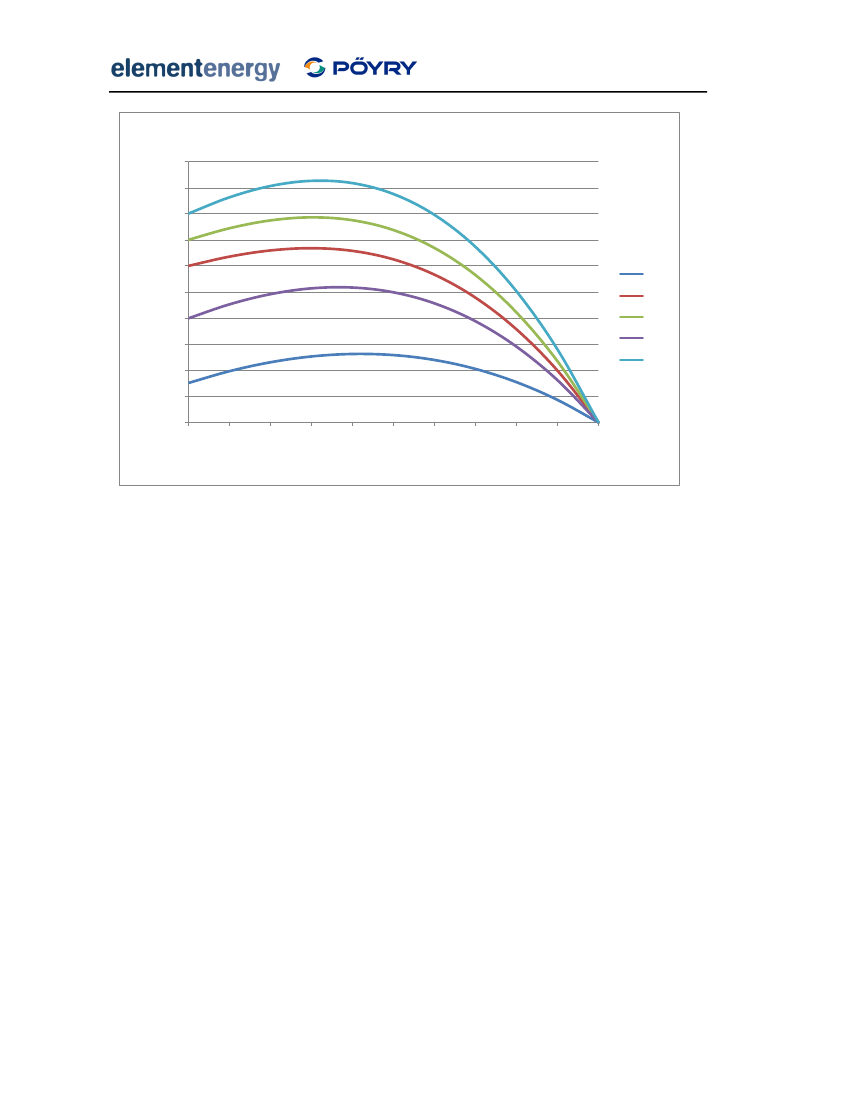
Penetration of new technologies tends to follow an S-shaped curve when market share isplotted against time. This is due to changes in demand and supply at different levels ofdeployment. For a novel technology entering the market place, investor demand is likely tobe low due to lack of awareness and technological uncertainty, as well as high costs due toimmature supply chains and manufacturing processes. In turn, the capacity of the supplychain is low since there is insufficient mass-market demand to justify large-scale investmentsin capacity. As technologies are taken up by early adopters, awareness and hence demandamong mass-market consumers increases. This in turn drives increased capacity in the supplychain. In conventional diffusion theory, it is assumed that the maximum rate of deploymentoccurs at a market share of 50%. After this point, consumer demand decreases as the pool ofremaining investors shrinks. For renewable electricity technologies, this reduction in demandalso reflects the increased project costs of less-optimal sites, for example those with lowwind speeds.To achieve an S-shaped deployment curve, a function relating the annual rate of deploymentto the proportion of absolute potential realised was used, as shown in Figure 11. Lessrestrictive barriers allow the cumulative deployment to grow faster and for the market tosaturate earlier than for a highly restrictive barrier. The exact shape of the curve is set foreach technology during the calibration of the model.
26
Design of Feed-in Tariffs for Great BritainFinal Report
Market barriers0.5% of additional potential available in each year
0.450.40.350.30.250.20.15
bM1bM2bM3bM4bM5
0.10.05000.10.20.30.40.50.60.70.80.91
Achievement of long-term potential
Figure 11 Market constraints implemented in the model. bM1 – bM5 represent different levels of marketconstraints.
3.4.3
Growth rate constraints
The social and market barriers above are applied independently to each of the technologysub-types. For example, if feed-in tariffs were to cause widespread deployment of large-scalePV but no uptake at the domestic, the proportion of absolute potential achieved will bedifferent for the two sub-types and hence the percentage of the remaining potential that canbe deployed in the following year will be different. However, given that the overall supplychains are very similar for the PV industry as a whole, a technology-specific growth constraintis applied across each technology which sets a limit on the increase in annual deploymentrelative to last year’s sales.The maximum growth rates assumed for each technology are shown in Table 4. Technologieswith low current deployment in the UK have higher growth rates than large-scale andestablished technologies. The growth rates are set to reflect experience from other countrieswhich have seen significant deployment of renewable energy technologies. For example,under the German Feed-in Tariff, the growth rate of the PV industry has averaged 70% peryear for the last five years. However, this growth has been highly variable, with a decrease intotal sales in one year and a 300% growth rate in another. For technologies with very lowcurrent sales in the UK, such as PV, it is likely that spare supply capacity in other countries27
Design of Feed-in Tariffs for Great BritainFinal Report
both in manufacturing and installation could be used to meet rapidly growing UK demand.This means that in the short term, annual UK sales may be able to grow significantly quickerthan 70% per year. For this reason, it is assumed that each technology may undergo a one-time increase in annual sales, as shown in Table 4. For example, if a Feed-in Tariff introducedin 2010 for PV stimulates sufficient demand, the industry may install up to 50MW in the firstyear of the policy, despite this being more than 70% higher than current deployment of lessthan 10MW per year. Once the annual sales exceed 50MW, the industry then grows at themaximum growth rate shown. It should be noted that these one-time increases areconservative estimates. During the growth of the PV industry in Germany, much larger yearon year increases in sales occurred in individual years. However, the average annual growthrate over the last five years has been close to 70%.Table 4 Maximum technology growth rates
TechnologyPVWindHydroWaveTidalBiomassWaste
Maximum annual growth rate One time increase permitted70%50MW50%50MW70%10MW70%10MW70%10MW50%10MW30%10MW
3.5 Model CalibrationOnce the technology cost and performance data had been combined with the absolute anddynamic resource potentials, the model was calibrated to ensure that it reflected experienceof other countries which have successfully deployed renewable energy technologies.Calibration was achieved by setting the market and social barriers for each technology sothat they matched historic UK uptake in the baseline, and levels of uptake under generousFeed-in Tariffs were consistent with growth rates observed in other countries and industries.
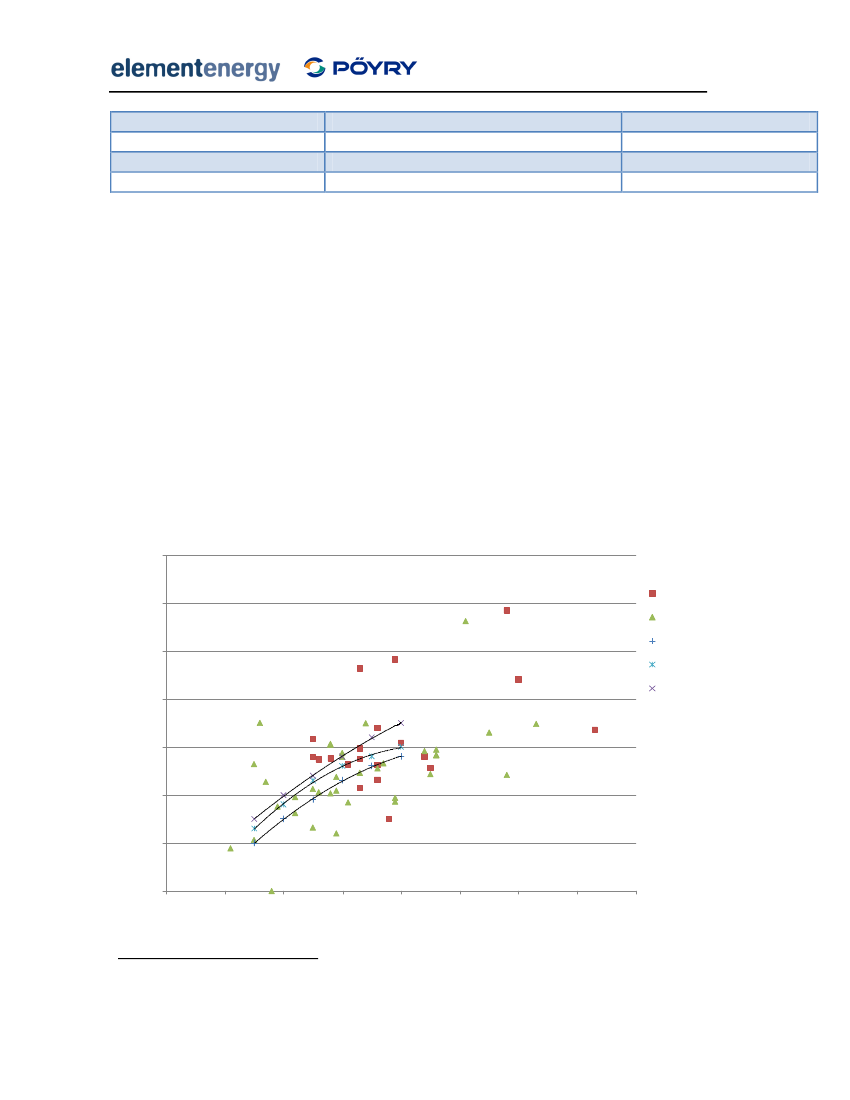
Figure 12 shows the results of the calibration process for PV. Two data series have been usedfor the calibration. The first is historic uptake that occurred in the UK since the start of thedecade, based on data from the IEA. Annual PV installations remained very low, at between 3and 5MW. Since many of these installations were supported with capital grants under theMajor PV Demonstration Programme and Low Carbon Buildings Programme, historic capitalsubsidies were included in the model. The second data series used in the calibration is PVdeployment in Germany under the Feed-in Tariff. Since its introduction in 2002, the PVindustry has grown rapidly, with over 1GW of modules installed in 2008. Although the tariff28
Design of Feed-in Tariffs for Great BritainFinal Report
structures are slightly different from the ones modelled for the UK, and soft loans werewidely available to consumers when the policy began, the German deployment data stillprovides a useful indication of how PV may grow in the UK under generous policy support.For the purposes of the calibration, the German data were time-shifted so that the policy‘started’ in 2010. Figure 12 shows that the model can closely replicate both historic UKuptake and deployment under a German-style feed-in tariff.There were no data available on the historic deployment of sub-5MW systems underEuropean Feed-in Tariffs for wind power, since the UK is unique in imposing a 5MW eligibilitylimit. In this case, historic UK uptake data from the ROC Register6on sub-5MW generatorswere used in the calibration. For technologies with no historic deployment such as wave andtidal power, the barriers were set equal to other technologies for which data were available.
Model calibration - historic PV uptake10000
Annual PV uptake (MW per year)
1000
UK100Germany (timeshifted)UK Predicted
10
120002005201020152020
Figure 12 Calibration of model against historic uptake – PV
6
https://www.renewablesandchp.ofgem.gov.uk/
29
Design of Feed-in Tariffs for Great BritainFinal Report
3.6 Fuel pricesFuel prices used in the model are based on DECC’s fossil fuel price scenarios. These containprojections for the price of electricity and gas for domestic, commercial and industrialconsumers from 2008 to 2025. The projections are split into four scenarios from a low energydemand case to a ‘significant supply constraints’ scenario, where prices increase substantiallytowards the end of the decade. The tables below show the projected electricity prices foreach of the four scenarios. All figures are in 2008 prices. The central projection (‘Timelyinvestment, moderate demand’) was used in all model runs unless stated otherwise.The figures below include a CO2price and are the prices that consumers pay for electricity. Inthe absence of additional support under the Feed-in tariff, the prices also represent the valuereceived by renewable energy generators. Electricity that is generated and used on-site isvalued at the retail price, while exported electricity is valued at the wholesale price. Smallrenewable energy systems that are linked to nearby buildings, for example PV and small windturbines, are assumed to export 50% of their output to the grid, while large-scaletechnologies are assumed to export their entire output at the wholesale price.For the purposes of calculating resource costs in the cost-benefit analysis, modifiedelectricity prices were used that did not include carbon prices or taxes.Table 5 Electricity prices – Low Energy Demand
YearDomestic(p/kWh)Commercial (p/kWh)Industrial (p/kWh)Wholesale (p/kWh)200814.939.9711.467.38201012.487.649.124.78201511.947.749.224.43202012.858.5910.084.56
Table 6 Electricity prices – Timely investment, moderate demand
Year2008201020152020
Retail (p/kWh)Commercial (p/kWh)Industrial (p/kWh)Wholesale (p/kWh)14.939.9711.467.4215.0610.0911.585.9214.6010.2711.755.8515.8711.4712.966.25
Table 7 Electricity prices – High demand, producers’ market power
Year
Retail (p/kWh)
Commercial (p/kWh)
Industrial (p/kWh)
Wholesale (p/kWh)
30
Design of Feed-in Tariffs for Great BritainFinal Report
2008201020152020
14.9315.8116.3418.42
9.9710.8111.9213.90
11.4612.3013.4115.39
7.387.948.599.83
Table 8 Electricity prices – High demand, significant supply constraints
Year2008201020152020
Retail (p/kWh)Commercial (p/kWh)Industrial (p/kWh)Wholesale (p/kWh)14.939.9711.467.3817.8512.7514.249.8719.1114.5616.0511.2220.6115.9917.4811.91
31
Design of Feed-in Tariffs for Great BritainFinal Report
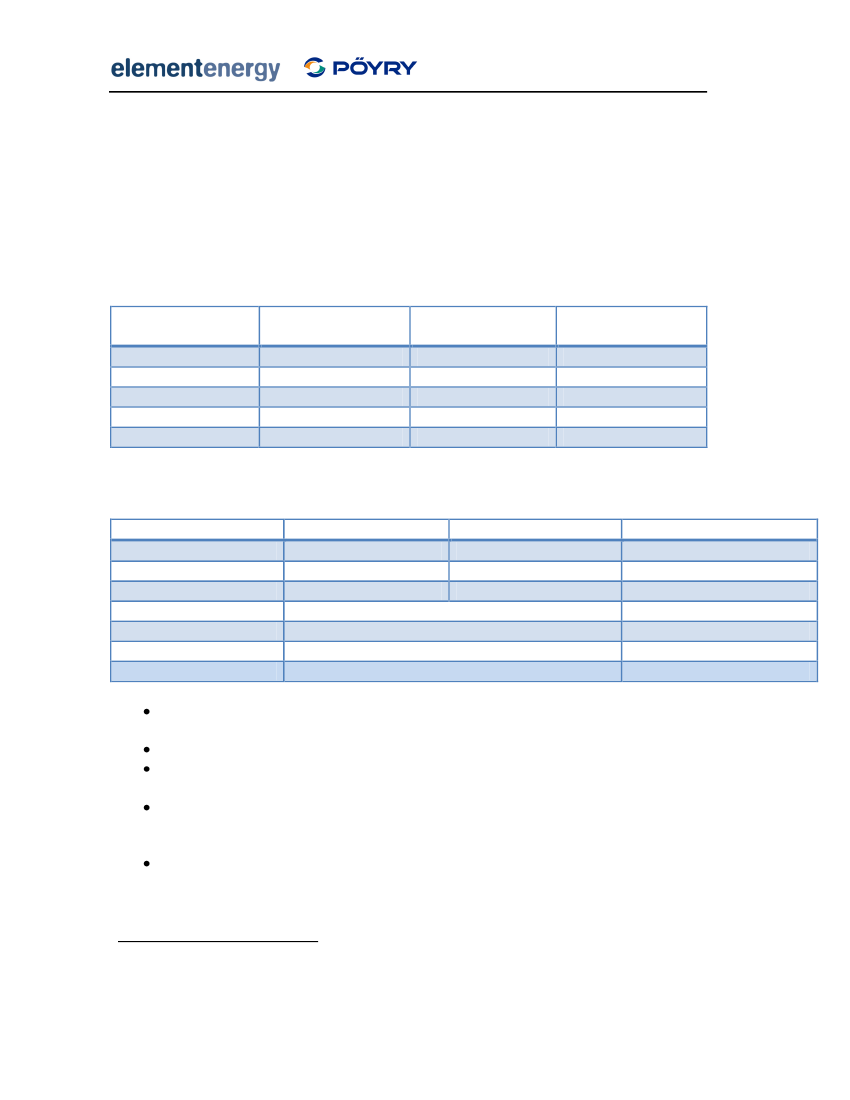
3.7 Model outputsFor each Feed-in Tariff scenario, the primary model outputs are electricity generation,installed capacity and CO2savings for each year of the policy. These outputs are split bytechnology, size, site type (for example, different wind speed bands) and investor type. Forclarity, only partially disaggregated results are shown in the summary graphs and tables inthe Results section.In addition to the primary outputs, the model also provides a detailed cost benefit analysis ofeach Feed-in Tariff using a methodology agreed with the DECC. Numerous studies that haveconducted cost benefit analyses of low carbon policies for all technologies and scales havedone so using a wide range of input assumptions and methodologies. This causes difficultieswhen the costs and benefits of different policies are compared across studies. For thisreason, the CBA methodology is described below. Table 9 shows the summary cost benefitanalysis outputs as they are presented in the Results section, and each output is describedbelow.Table 9 Example of summary CBA outputs
ParameterAdditional electricity generation in 2015Additional electricity generation in 2020Renewable heat generation in 2020Annual resource cost in 2020Cumulative resource cost to 2020Annual resource cost in 2020Annual cost to consumers in 2020Cumulative cost to consumers to 2020Annual CO2 savings in 20203.7.1
UnitTWhTWhTWh£m£m£/MWh£m£mMtCO2
Value1.25.79.11991,037353311,5232.4
Additional electricity and heat generation
Throughout the CBA, a counterfactual scenario is deducted so that all values are additional tothe baseline. The counterfactual scenario is assumed to be the Business as Usual case as setout in the Results section, and assumes that the Renewables Obligation continues to be the32
Design of Feed-in Tariffs for Great BritainFinal Report
main source of support for renewable electricity technologies. This means that additionalelectricity generation in 2015 is less than the total generated in a given scenario. Forexample, although the additional electricity generation in 2020 in the table above is 5.7TWh,the total generated in the scenario is 8TWh since 2.3TWh is generated in the baseline.
3.7.2
Resource costs
Resource costs are defined as the costs to the country of pursuing a particular policy relativeto a counterfactual scenario. The costs include capital spent on equipment and operatingcosts, and in this case include savings from electricity generated by renewable technologies.Resource costs explicitly exclude transfers, or payments made from one part of society toanother, and so exclude taxes, subsidies and CO2prices.In order to calculate resource costs, capital costs are annualised over the equipment lifetime.Capital costs are annualised using an interest rate of 10% for all consumers, which representsa standard cost of capital that might be applied to renewable energy projects. The cost ofcapital does not attempt to capture the large range of discount rates seen in domesticconsumers, which are represented in the uptake model using a distribution of hurdle rates.This is because the observed high hurdle rates capture a range of hidden and ‘hassle costs’that do not accrue to the country as a whole. Therefore the discount rates used in the CBAreflect only the actual cost of capital.The electricity produced each year by renewable technologies is valued at electricity pricesprovided by DECC, which exclude the carbon price. Costs occurring in the future arediscounted back to present values using the Green Book social discount rate of 3.5% peryear.The annual resource cost per MWh in 2020 is defined as the additional resource cost in thatyear relative to the baseline divided by the additional electricity generation in that year. Thisfigure is also discounted back to 2008 prices.3.7.3Costs to consumers
Since the tariffs paid to renewable energy generators under the Feed-in Tariff are funded byelectricity consumers, the cost to consumers records the total value of tariffs paid each yearunder the policy. Since money paid to generators under a fixed tariff includes the value of theelectricity itself, the wholesale price is deducted from the total tariff paid when calculatingthe cost to consumers. For example, a fixed tariff of £200/MWh represents an additional costto consumers of £150/MWh if the electricity itself is valued at £50/MWh. Like the resourcecosts, all future costs are discounted to present values prices at 3.5% per year.
33
Design of Feed-in Tariffs for Great BritainFinal Report
3.7.4
Annual CO2savings
To avoid double counting CO2savings from renewable heat production in this study andparallel work on the Renewable Heat Incentive, unless stated otherwise the CO2savingsreported here related only to the renewable electricity generation. The CO2displacement forrenewable electricity is based on DECC’s projection for the marginal long term emissionsfactor, assumed to be constant throughout the model timeframe at 0.43t/MWh. Biomass isassumed to have a net CO2intensity of zero.
34
Design of Feed-in Tariffs for Great BritainFinal Report
4 BaselineWith the exception of landfill and sewage gas, historic investment in sub-5MW renewableelectricity technologies has been low. However, due to changing fossil fuel prices andtechnologies, it is likely that there will be an increase in installed capacity between now and2020 under current policies. The Business as Usual scenario is a projection of likelydeployment under the current policy regime, without any support from a Feed-in Tariff. Inmany of the model outputs, this baseline is then deducted from the installations occurring ina given Feed-in Tariff scenario, to give theadditionaldeployment under the FIT.4.1.1Baseline assumptions
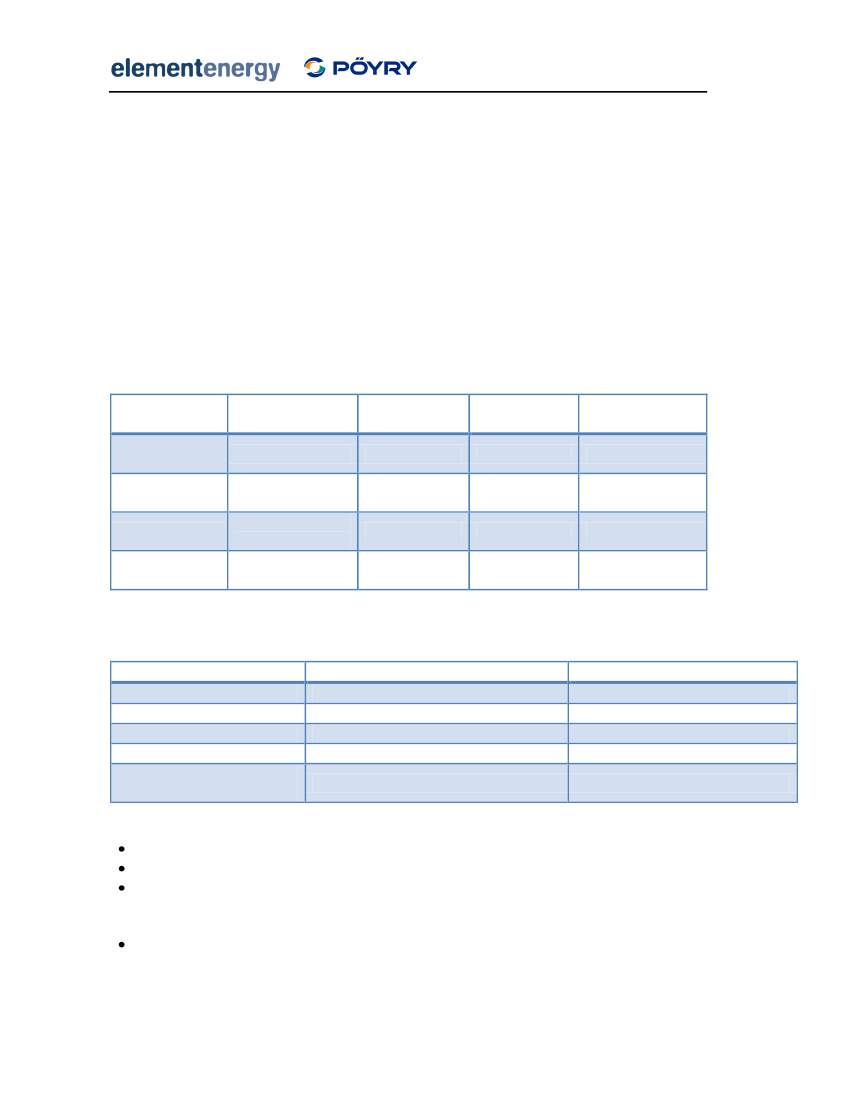
In April 2009, the primary support mechanism for renewable electricity, the RenewablesObligation, was modified to encourage deployment of a wide range of renewabletechnologies. The support payable is banded by technology, so that post-demonstration andemerging technologies receive higher support.The baseline includes the following support for renewable generators under the bandedRenewables Obligation. Note that for simplicity in this model, support from the Low CarbonBuildings Programme is assumed to end at the end of 2009 so that ROCs are the only supportmechanism available between 2010 and 2020. Previous analysis by Element Energy suggeststhat likely supplier contributions to small PV and wind systems under CERT or a post-2011Supplier Obligation are too low to substantially improve the economics of these systems, andso these policies have not been explicitly modelled in the baseline.Table 10 RO support received under Business as Usual
TechnologyMicrogeneration (all systems under 50kWe)PVWave and tidal powerAnaerobic digestionAdvanced thermal treatmentBiomass CHPWindHydroBiomass (electricity only)
ROCs per MWh222222111
35
Design of Feed-in Tariffs for Great BritainFinal ReportTable 11 Electricity prices in the Business as Usual scenario (2008 prices)
Year20082010201520204.1.2
Retail (p/kWh)Commercial (p/kWh)Industrial (p/kWh)Wholesale (p/kWh)14.939.9711.467.4215.0610.0911.585.9214.6010.2711.755.8515.8711.4712.966.25
Baseline results
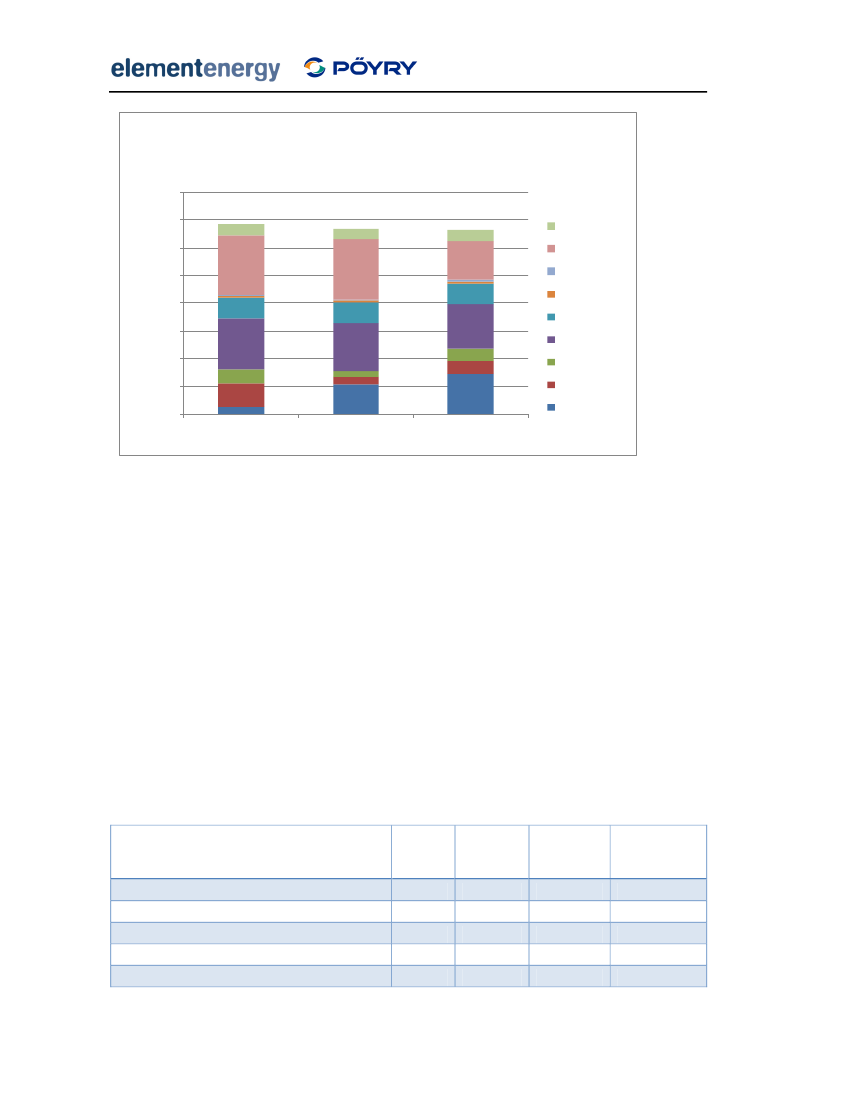
Figure 13 shows the total new sub-5MW generation in 2020 under Business as Usual. Notethat this excludes projects commissioned before 2010. Total generation in 2020 is 2TWh,with uptake dominated by large scale technologies such as on-shore wind, hydro power andwaste. The baseline results suggest that the offering 2 ROCs per MWh to anaerobicdigestion, when combined with revenues from gate fees, is sufficient to drive significantuptake. Over 80 1MW anaerobic digestion plants are installed by 2020. Uptake of advancedthermal treatment plants is lower, with 0.1TWh of generation in 2020. Although the levelisedcosts per MWh are similar to anaerobic digestion, the absolute potential is lower due tocompetition for waste feedstocks from other technologies, such as incineration with CHP, orlarger thermal treatment plants. For example, the first advanced thermal treatment plant togain ROC accreditation was a 2MWeEnergos plant on the Isle of Wight. However, this is ademonstration scale facility; a planned commercial scale plant in Derbyshire is sized at8MWe.7This suggests that the future role of sub-5MW advanced thermal treatment plantsmay be limited.
7
http://www.energ.co.uk/?OBH=69&ID=21
36
Design of Feed-in Tariffs for Great BritainFinal Report
Total electricity generation by sub-5MW RES-E bytechnology - BaselineTotal electricity generation (GWh per year)
2,500Waste2,0001,5001,000Bio
TidalWaveHydro
Wind (Large)5000201020152020Wind (Small)PV (Large)
PV (Small)
Figure 13 Electricity generation by sub-5MW RES-E in 2020 under Business as Usual
Table 12 shows the size distribution of uptake under the baseline. Although the majority ofinstalled capacity is from large-scale projects, there is significant uptake of small hydroinstallations. This suggests that 2 ROCs per MWh is sufficient to stimulate uptake of sub-50kW hydro power. There are also over 4,000 small wind installations, defined as those withpeak capacities of between 1.5kW and 50kW. Uptake of the other emerging or post-demonstration technologies is negligible, with no deployment of wave or tidal power in thebaseline. PV uptake is also extremely low, with 125 systems being installed in 2019 and 2020.Given the assumption that consumers make purchasing decisions based on rates of return,the model is unable to accurately represent uptake by consumers who are willing to acceptnegative rates of return, which is the case with PV and micro-wind in the baseline. Such earlyadopters are likely to be few in number compared to the absolute potential for thesetechnologies, and so the distribution of hurdle rates in the model is designed to provide agood representation of mass-market behaviour.
37
Design of Feed-in Tariffs for Great BritainFinal Report
Table 12 Number of installations in 2020 by technology size - Business as Usual
TechnologyPV
Wind
HydroWaveTidalBiomass
Waste
Gas CHP
SizeDomesticSmallLargeStand-aloneMicroSmallMediumLargeSmallLargeAllAllCHPElectricityonlyATTADIncinerationStirlingFuel cell10kW gas50kW gas
Annual GWhCumulativeCumulative electricityAnnual CO2installations MW ingeneration in savings in 2020in 202020202020(MtCO2)125000.00000.00000.0004,340927436530000038810146,8358559315,237153,858003445495900000178840147947791993005781,158132360000121619250730512792,2373,2980.00.00.00.00.50.00.10.00.00.00.00.10.30.00.00.30.00.11.01.4
TotalrenewableTotal inc.CHP
Since CHP is strictly a low carbon rather than fully renewable technology, its uptake is notincluded in the renewable electricity generation and cost-benefit analysis outputs below.Results for CHP are shown separately in Section 5.8.
38
Design of Feed-in Tariffs for Great BritainFinal Report
5 Results and analysisDesigning a Feed-in Tariff to drive uptake of renewable electricity technologies is aninherently complex task. The sizes of the technologies to be stimulated vary from 1kWdomestic systems to 5MW industrial plants, and the technologies themselves range frombeing cost-effective under existing policies to having generating costs over five times theretail electricity price. In addition, costs of many technologies are expected to decrease overtime as supply chains mature, and support levels must reflect these changes if significantoverpayments to investors are to be avoided.A thorough review of qualitative Feed-in Tariff design issues has been conducted by ElementEnergy and Pöyry as part of this project. This review draws on a wide range of policyexperience gained in other European countries that have successfully implemented Feed-inTariffs. Some design issues, such as the process for reviewing tariff levels, cannot beinvestigated using a quantitative model, and so are covered exclusively in the qualitativereport. However, there is a wide range of issues, such as tariff banding, degression and tariffpayment periods whose effects on uptake, diversity, and costs can be directly quantified. Inthe following section, these issues are investigated by setting a ‘target’ for the amount ofrenewable generation desired by a given date. By holding overall uptake constant, the effectsof policy design on uptake of different technologies, as well as policy costs, can beinvestigated and seen more clearly. The generation ‘targets’ used in the main scenarios are2% and 3.5% of UK electricity demand in 2020. This demand is projected by DECC to be386TWh in 2020, so the targets correspond to approximately 8TWh and 13.5TWhrespectively.
39
Design of Feed-in Tariffs for Great BritainFinal Report
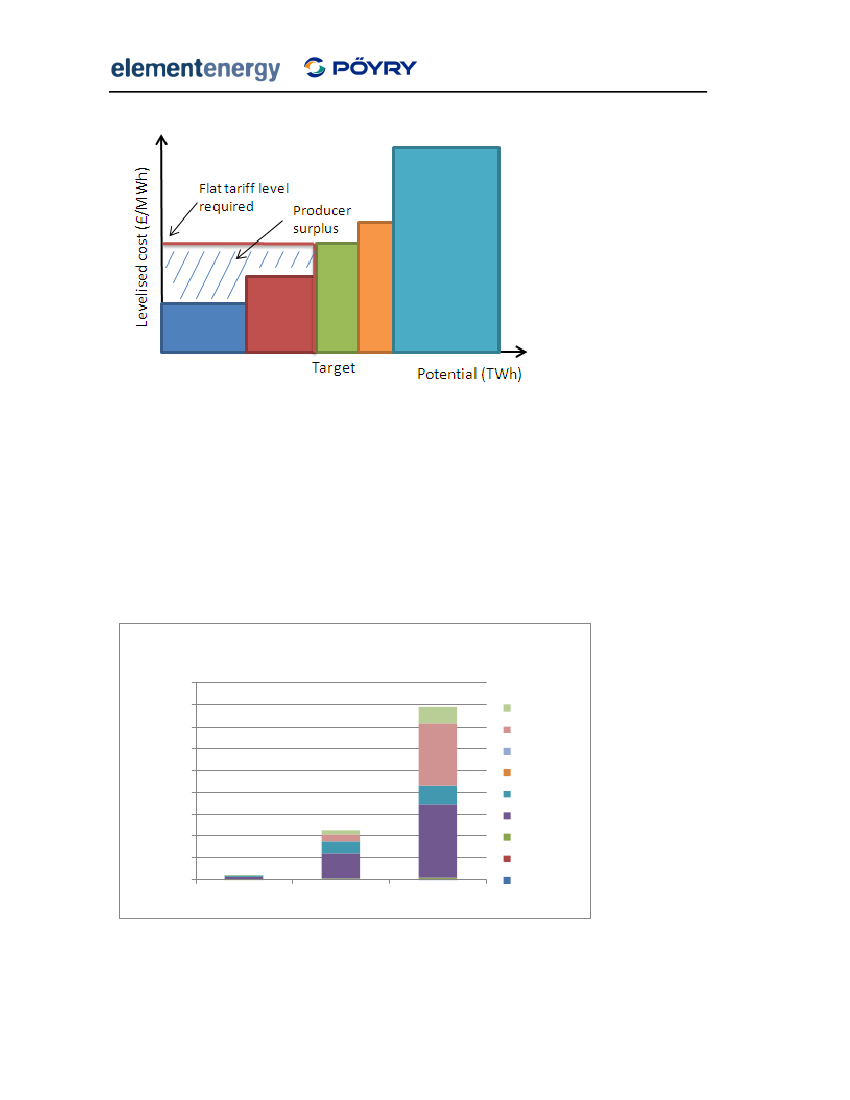
5.1 2% targetFor a given target, there is a potentially infinite number of technology combinations that willdeliver the electricity generation required. We have used a number of policy approaches todetermine the tariff levels for each scenario. In the simplest case, the approach is to meetthe generation target while minimising the policy costs as measured by resource cost or thecost to consumers. More complex scenarios aim to encourage the deployment of severaltechnologies, such as community- or domestic-scale PV or wind, which will result in highercosts than the ‘least-cost’ approach.5.1.1Flat tariffs
The simplest tariff structure of all is one in which a single tariff is paid to all generators,regardless of technology, size or year of deployment. The value of the single tariff is equal tothe levelised costs of the most expensive technology required to meet the target. In otherwords, technologies are deployed in ascending order of cost along the supply curve (seeFigure 14). Due to the distribution of hurdle rates assumed in the model, each technology hasa range of levelised costs and the supply curve is not as discrete as the one shown. Unlessotherwise stated, all tariffs are ‘fixed tariffs’, so levels refer to the total revenue received bythe generator (i.e. there are no additional revenues from sale of electricity to theconventional electricity market). A comparison of policies based on flat and premium tariffscan be found in Section 5.4. For a 2% target, the tariff level required is £155/MWh.In all feed-in tariff scenarios described below, it is assumed that biomass CHP receivessupport under the RHI for each MWh of renewable heat delivered. The value of the RHI isassumed in the model to remain constant through time at £10/MWhthfor a CHP technologywith a heat to power ratio of 2.5 to 1, this support is equivalent to an extra electricity tariff of£25/MWherelative to an ‘electricity-only’ plant. This is a similar value to the extra 0.5ROCspayable under the banded Renewables Obligation for biomass plants that operate in CHPmode. For a fuller discussion on biomass electricity and the interaction between the FIT andRHI, see Section 5.7.
40
Design of Feed-in Tariffs for Great BritainFinal Report
Figure 14 Setting a flat tariff to achieve a generation target using lowest-cost technologies
Figure 15 shows the electricity generation in 2020 with a flat, fixed tariff of £155/MWh. Thetarget is met exclusively by large-scale technologies, with large wind-turbines providing3TWh in 2020. The combination of the FIT and RHI is sufficient to drive uptake of over700MW of biomass CHP, delivering 2.5TWh of renewable electricity in 2020. The majority ofthis capacity is in standalone installations linked to large individual heat demands rather thansystems connected to district heating networks, which are significantly more expensive.Uptake of higher cost technologies remains negligible in this scenario, since £155/MWh iswell below the levelised costs of marine systems and PV.Total electricity generation by sub-5MW RES-E bytechnology - 2% least costTotal electricity generation (GWh per year)9,0008,0007,0006,000WasteBio
TidalWaveHydro
5,0004,0003,0002,0001,000
Wind (Large)Wind (Small)PV (Large)
0201020152020
PV (Small)
Figure 15 Electricity generation in 2020 - £155/MWh flat tariff
41
Design of Feed-in Tariffs for Great BritainFinal Report
Table 13 shows a summary of the cost-benefit analysis outputs for the flat tariff. All outputsin the CBA are relative to the baseline, so theadditionalelectricity generation in 2020 is5.7TWh, since 2TWh were generated under Business as Usual. The cumulative resource costin 2020 is £1 billion. The cumulative cost to consumers in 2020 is £1.5 billion, implying thatsome investors are receiving higher revenues than those that would be required to make theinvestment attractive.Table 13 Summary CBA outputs - £155/MWh flat tariff
ParameterAdditional electricity generation in 2015Additional electricity generation in 2020Renewable heat generation in 2020Annual resource cost in 2020Cumulative resource cost to 2020Annual resource cost in 2020Annual cost to consumers in 2020Cumulative cost to consumers to 2020Annual CO2 savings in 20205.1.2Tariff banding
UnitTWhTWhTWh£m£m£/MWh£m£mMtCO2
Value1.25.79.11991,037353311,5232.4
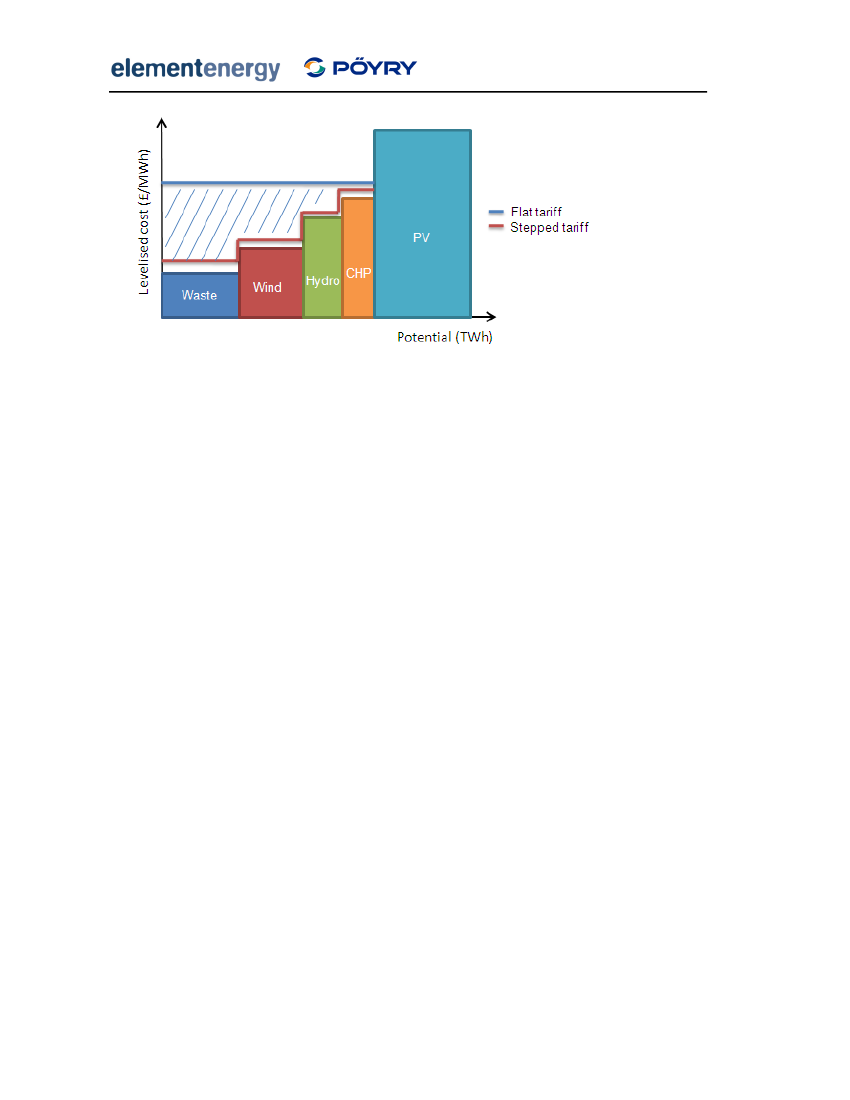
Wherever technologies show significant differences in cost, a flat tariff design will result inoverpayments to the lowest-cost generators. As the generation target increases and highercost technologies on the supply curve are required to meet that target, the overpaymentsincrease significantly. The shaded area in Figure 14 shows the producer surplus for low-costgenerators. Producer surplus is defined as the difference between what an investor is paidand the minimum amount he would have to be paid and still make the investment. Onesolution to overcome this issue, and the one employed in almost all EU Feed-in Tariffschemes, is to band the tariff by technology. Tariffs can be set so that each technologyreceives support equal to its levelised costs per MWh, with more costly technologiesreceiving higher support. For technologies with a wide range of costs, such as large windturbines at different wind-speeds, a single tariff is set for the purposes of the model thatprovides sufficient returns for the majority of sites.Figure 16 illustrates a banded Feed-in Tariff design, where tariff levels are set equal to thelevelised costs for each technology. The shaded area represents the reduction in producersurplus of the banded tariff relative to a flat tariff delivering the same overall generationtarget.
42
Design of Feed-in Tariffs for Great BritainFinal Report
Figure 16 Illustration of a stepped tariff design
The potential for reducing rents through technology banding is relatively limited in the 2%scenario. Waste technologies are available at a lower cost than £155/MWh, and reducing thetariff paid to these projects reduces the cumulative cost to consumers in 2020 by £50 millionwithout affecting overall electricity generation. The limited effect of banding occurs becausethe rents caused by differences in costs between technologies are small compared with costdifferences within a technology due to scale or resource. These differences are particularlylarge for wind turbines at different wind-speeds, where levelised costs in 2010 vary frombetween £70/MWh at 8m/s to £150/MWh at 5.5 m/s. There is also significant variation inlevelised costs between different turbine sizes at the same wind-speed. To match tariff levelsto the levelised costs for each turbine and wind-speed band would require a large number ofbands, adding significant administrative complexity to the policy. Options for reducing rentsfor low-cost generators without multiple tariff bands include volume-based tariffs, wheretariff levels decrease as electricity output rises. This means that a wind turbine in a low wind-speed site receives a greater proportion of its tariff payments at a higher level, increasing theaverage revenue per MWh generated. In Germany, the energy outputs of large turbines arecompared against a reference turbine, and machines with lower outputs receive higherpayments. The higher payments are set so that although they provide good returns oninvestment for a wide range of sites, the highest returns are always available at high wind-speed sites. This ensures that turbines are preferentially deployed at the most cost-effectivesites.5.1.3Least cost scenarios
If the banded tariff described in Section 5.1.2 were modified to include varying tariffs fordifferent wind-speeds, it would be close to the lowest cost solution for meeting the 2%target. Since the cost of a policy can be measured by resource cost or the costs passed on toelectricity consumers, it useful to define the term ‘least cost’, since a given design canminimise one cost without the other.43
Design of Feed-in Tariffs for Great BritainFinal Report
A flat tariff set to deliver a given target will always minimise the resource cost of the policy,since technologies are always deployed in ascending order on the supply curve. As thegeneration target increases, a higher flat tariff level will be required to deliver that target,and the average resource cost will increase. The tariff will still deliver the lowest costtechnology mix at the higher target.However, as an unbanded, flat tariff is increased to deliver a greater amount of renewableelectricity, the rents paid to low cost generators increases, so the policy is not ‘least-cost’with respect to the subsidy costs. Where the objective of the policy is to minimise the overallsubsidy costs passed on to consumers, and hence the impact on electricity bills, banding is anessential part of the policy design. Thus a well-designed, banded tariff will minimise both theresource costs and costs to consumers.It should also be noted that the cost of a policy depends not only on the technology mixdeployed, but also on profile of uptake over time. Given that money spent in the future isdiscounted by government at the social discount rate 3.5% per year, a policy that leads to thehighest deployment close to 2020 will have a lower policy cost than the same generationdeployed earlier in the decade.This applies even to technologies whose costs are not projected to decrease over time,although for small scale technologies whose costs are expected to decrease significantlythere are additional savings. Delaying deployment of small wind and PV until close to 2020will significantly reduce both the resource costs and the tariff levels required to drive theuptake. The risk with this approach is that by failing to encourage uptake early in the decade,supply chains do not develop and technology costs remain high. In addition, industry may notbe able to respond quickly to rapidly increasing demand close to 2020 if they have not grownsteadily over previous years. This risk is higher for some industries than others. For example,the small wind industry is primarily UK-based, and may depend on UK policy support to growover the coming years. In contrast, a global industry such as PV is unlikely to be affected bylow demand in individual countries. If UK demand were to increase rapidly in a particularyear, spare capacity abroad, both in manufacturing and installation, would be available tomeet it.5.1.4Enhancing technology diversity
While the least-cost scenarios above are effective at meeting a 2% generation target, they donot lead to an increase in diversity of supply since the technologies deployed are the same asthose installed under the RO, albeit in a different size range. Government is aware ofpotential benefits to encouraging uptake of a wider range of technologies, includingcommunity- and domestic-scale systems. These benefits include increased security of supplyas well as less tangible benefits such as engaging consumers and increasing energyawareness.
44
Design of Feed-in Tariffs for Great BritainFinal Report
For a given generation target, a diverse technology mix increases both resource costs andcosts to consumers since technologies are no longer being deployed in order along the supplycurve. The figures below show two scenarios based on increasing the technology diversityrelative to the least-cost design. The ‘diverse mix’ aims to drive uptake of a wide range oftechnologies, although the majority of installed capacity in 2020 is still made up of large scaletechnologies. The ‘community bias’ scenario goes further, and specifically targetscommunity- and domestic-scale technologies over large installations. The exact tariff levelsapplied to each technology are somewhat arbitrary, since they are designed to drive uptakeof a wide range of technologies while still meeting an 8TWh overall target. However, thesescenarios are a useful demonstration of an indicative technology mix based on the resourcepotentials, and the resulting policy costs. The tariff levels themselves are set with severaltechnology-specific targets in mind, such as 1TWh from small-scale PV by 2020 in thecommunity scenario. However, the choice of exact tariffs is subjective and simply serves toillustrate the effects of diversifying the technology mix. Table 14 below shows the tariffslevels and degression rates for the two scenarios. The degression rate is the rate at whichtariffs are reduced each year for new installations, to reflect reductions in the costs of thosetechnologies (see Section 5.3).Table 14 Tariff levels for the diverse and community scenarios
2% diverse mixTechnologyPVSizeDomestic4-10kW10-100kW100-5000kWStand-aloneMicro1-15kW15-50kW50-250kW250-500kW500-3000kW1-10kW10-50kW50-500kW500kW+All typesAll typesHeat turbine
2% community bias
Wind
Hydro
WaveTidalBiomass
Initial tariff DegressionInitial tariffDegression (%(£/MWh)(% per year) (£/MWh)per year)£4005%£4005%£3805%£3805%£2505%£3505%£2505%£3005%£2505%£3005%£2000%£2000%£2000%£3000%£2000%£2500%£2000%£2000%£2000%£1800%£1600%£1430%£1450%£1450%£1450%£1450%£1450%£1400%£1400%£1400%£2502%£2502%£2500%£2500%£1300%£1300%45
Design of Feed-in Tariffs for Great BritainFinal Report
Waste
ORCSteam turbine CHPElectricity onlyElectricity onlyADIncineration
£130£130£0£100£100£100
0%0%0%0%0%0%
£130£130£0£100£100£100
0%0%0%0%0%0%
Figure 17 and Figure 18 below show the total generation mix for the two scenarios. Totalgeneration is 8TWh in both scenarios, and large wind remains the largest single contributorto the target. However, the technology diversity is significantly increased compared to theleast cost scenario. In the ‘community-bias’ scenario, over 1.2 TWh of electricity is generatedby over 500,000 domestic PV installations with a further 0.6TWh from larger building-attached systems. Small wind also makes a larger contribution to the overall target, with over47,000 small and medium turbines generating 1.1.TWh in 2020.
Total electricity generation by sub-5MW RES-E bytechnology - 2% diverseTotal electricity generation (GWh per year)9,0008,0007,0006,000WasteBio
TidalWaveHydro
5,0004,0003,0002,0001,000
Wind (Large)Wind (Small)PV (Large)
0201020152020
PV (Small)
Figure 17 Electricity generation under the 2% diverse scenario
46
Design of Feed-in Tariffs for Great BritainFinal Report
Total electricity generation by sub-5MW RES-E bytechnology - 2% communityTotal electricity generation (GWh per year)9,0008,0007,0006,000WasteBio
TidalWaveHydro
5,0004,0003,0002,0001,000
Wind (Large)Wind (Small)PV (Large)
0201020152020
PV (Small)
Figure 18 Electricity generation under a 2% community scenario
Increasing the technology diversity comes at a large cost premium over the least-costscenarios. The cumulative resource costs in 2020 increase from £1 billion in the least costscenario to £3.6 and £3.9 billion for the diverse and community scenarios, respectively.For both policies the overall cost to consumers is now lower than the resource cost. Thereare two reasons for this. The first is that the uptake of large wind is smaller in the diversescenarios due to lower tariff levels, which significantly reduces the rents paid to systems inoptimum sites. The second reason is due to the hurdle rates of consumers purchasing thedomestic systems. To represent the wide range of purchasing behaviour observed amongdomestic consumers, the population is assumed to have a distribution of hurdle rates. At oneend of the distribution, early adopter consumers require rates of return of only 3% per year,close to the social discount rate. At the other extreme, consumers require a return of 20%per year, consistent with observed behaviour in the energy efficiency sector.At the relatively low levels of domestic deployment in the 2% diverse scenarios, the tarifflevels are set so that technologies are purchased only by early adopters with relatively lowhurdle rates. In other words, the tariff levels provide returns of 3-5% per year to theseconsumers, but the cost to the economy is evaluated at 10%. This leads to negative rents,where consumers purchase systems despite the tariff level being lower than the levelisedcosts of the technology. The low hurdle rates of these early adopters can be explained by thefact that they have a low cost of capital, for example paying using their savings, or that theyplace an implicit value on aspects of the investment not captured by the cost-benefitanalysis, such as ‘green benefits’.
47
Design of Feed-in Tariffs for Great BritainFinal ReportTable 15 Summary CBA outputs - 2% diverse and community scenarios
ParameterAdditional electricity generation in2015Additional electricity generation in2020Renewable heat generation in 2020Annual resource cost in 2020Cumulative resource cost to 2020Annual resource cost in 2020Annual cost to consumers in 2020Cumulative cost to consumers to 2020Annual CO2 savings in 2020
UnitTWhTWhTWh£m£m£/MWh£m£mMtCO2
2% diverse1.85.73.95503,599974642,8122.4
2% community2.15.63.96083,9241095063,1282.4
Figure 19 shows the supply curve for sub-5MW renewable electricity for the 2% ‘communityscenario. The width of each bar represents the amount of electricity generated by eachtechnology in 2020, while the height shows the levelised cost of energy in 2020 (in £ perMWh). Note that for simplicity, only the 2020 technology costs are shown. For technologieswhose costs decrease over time, some of the resource shown in Figure 19 is deployed earlierthan 2020 and so has a higher generating cost. All of the generation costs are calculatedusing a 10% cost of capital over the project lifetime. The figure shows that the wastetechnologies have the lowest cost of electricity, since plants earn revenue from heat salesand waste gate fees. Anaerobic digestion makes the largest contribution of the sub-5MWwaste technologies. There is nearly 6TWh of resource available in 2020 for a generating costof less than £150/MWh. There is then a significant gap between the generating costs ofbiomass CHP and small wind turbines while the levelised cost of domestic PV is still£450/MWh in 2020, at a 10% rate of return.
48
Design of Feed-in Tariffs for Great BritainFinal ReportSub-5MW renewable electricity supply curve - 2% Community scenario
£500£450
Domestic PVSmall PV
£400Technology cost in 2020 (£/MWh)
£350
Large PVWave /tidalSmallwindBiomassCHP
£300£250£200
MediumwindLargehydro
£150£100
Large windWaste
£50£0
1
2
Renewable Electricity Production in 2020 (TWh)
3
4
5
6
7
8
Figure 19 Renewable energy supply curve - 2% community scenario
49
Design of Feed-in Tariffs for Great BritainFinal Report
5.2 3.5% targetThe analysis above shows that an 8TWh target for sub-5MW electricity generation in 2020can be met entirely using large scale technologies if the objective is to minimise the cost ofthe policy. For higher generation targets, demand and supply side barriers constrain the ratesof deployment of large scale technologies. This means that a more diverse mixture oftechnologies and scales is required. The following scenarios show the effect of raising theelectricity generation target from 2% of UK electricity to 3.5% by 2020, equivalent to13.5TWh per year.5.2.1Flat tariff
A 3.5% target can be met using a single flat tariff applied across all technologies and scales inthe same way as for the 2% tariff. The diverse technology mix required to meet a 3.5% targetsignificantly increases the value of the flat tariff from £155/MWh to £270/MWh, due to thehigh cost of small wind and PV systems. The technology mix for the flat tariff scenario isshown in Figure 20. Large scale technologies such as wind, biomass and hydro still contributeto the majority of the target, but significant deployment of PV occurs by 2020, with nearly2TWh of electricity generated in that year. Small wind also contributes 0.7TWh from 33,000turbines. Uptake of domestic scale systems remains low, with 0.1TWh generated from50,000 systems, while uptake of micro-wind turbines is negligible at the £270/MWh tariff.
Total electricity generation by sub-5MW RES-E bytechnology - 3.5% flat tariffTotal electricity generation (GWh per year)16,00014,00012,00010,0008,000WasteBio
TidalWaveHydro
6,0004,0002,000
Wind (Large)Wind (Small)PV (Large)
0201020152020
PV (Small)
Figure 20 Electricity generation in 2020 - £270 flat tariff
50
Design of Feed-in Tariffs for Great BritainFinal Report
5.2.2
Least cost tariff
The high cost of the small wind and PV systems in the generation mix leads to very high rentsbeing paid to lower cost, large scale projects. Table 17 shows the resource costs and costs toconsumers for the 2% and 3.5% least cost runs. A flat tariff of £270/MWh leads to acumulative costs to consumers by 2020 of £7bn, nearly double the cumulative resource of£3.6 billion. Unlike in the 2% scenario, there is significant scope to reduce these rentsthrough banding since they are primarily caused by cost differences between rather thanwithin technologies. Reducing tariffs for large wind, waste, hydro and biomass CHP as shownin Table 16 reduces the cumulative costs to consumers by £2.5bn to £4.4bn. This is stillhigher than the cumulative resource costs, with the remaining difference due to rents paid tolarge wind turbines in windy sites and biomass CHP in low cost stand-alone applications.Table 17 also shows the increased cost per MWh of meeting the target, which is £69/MWhfor the 3.5% least cost compared with £36/MWh for the 2% flat tariff.Table 16 Tariff levels for the 3.5% least cost scenario
TechnologyPV
Wind
Hydro
SizeDomestic4-10kW10-100kW100-5000kWStand-aloneMicro1-15kW15-50kW50-250kW250-500kW500-3000kW1-10kW10-50kW50-500kW500kW+All typesAll typesHeat turbineORCSteam turbine CHPElectricity onlyElectricity onlyAD
WaveTidalBiomass
Waste
Initial tariffDegression(£/MWh)(% per year)£2800%£2800%£2750%£2300%£2000%£2700%£2700%£2700%£2700%£2400%£1600%£2700%£2700%£2700%£2000%£2700%£2700%£1900%£1900%£1900%£00%£1000%£1000%51
Design of Feed-in Tariffs for Great BritainFinal Report
Incineration
£100
0%
Table 17 Comparison of rents in the 2% and 3.5% least cost runs
ParameterAdditional electricity generation in 2015Additional electricity generation in 2020Renewable heat generation in 2020Annual resource cost in 2020Cumulative resource cost to 2020Annual resource cost in 2020Annual cost to consumers in 2020Cumulative cost to consumers to 2020Annual CO2 savings in 20205.2.3
UnitTWhTWhTWh£m£m£/MWh£m£mMtCO2
2% flattariff1.25.79.11991,037353311,5232.4
3.5% flattariff2.311.113.98443,538761,6136,7994.8
3.5%leastcost2.411.414.27783,284681,0444,2744.9
Diverse and community scenarios
Although a wide range of technologies is deployed in the 3.5% least cost scenario, uptake ofdomestic and community-scale systems remains relatively low. For example, the cumulativePV uptake by 2020 at all scales is 2.5GWe, which is small compared to cumulative uptake of5GW in Germany since the introduction of the Feed-in Tariff.In the following scenarios, the policy emphasis is shifted from lowest total cost in favour ofencouraging small-scale technology uptake. The diverse scenario encourages greater uptakeof high cost technologies at all scales, while the community scenario specifically targetscommunity and domestic installations. Table 18 shows the tariff levels for the two scenarios.Tariffs for PV and small wind are degressed each year to match expected reductions intechnology costs and to encourage uptake in the early years of the policy.Table 18 Tariff levels for the 3.5% diverse and community scenarios
3.5% diverseTechnologyPVSizeDomestic4-10kW10-100kW100-5000kWStand-aloneMicro
3.5% community tariff
Wind
Initial tariff DegressionInitial tariff Degression (%(£/MWh)(% per year) (£/MWh)per year)£4205%£4505%£4205%£4505%£3505%£3705%£3205%£3205%£3005%£3005%£3003%£3003%52
Design of Feed-in Tariffs for Great BritainFinal Report
Hydro
1-15kW15-50kW50-250kW250-500kW500-3000kW1-10kW10-50kW50-500kW500kW+All typesAll typesHeat turbineORCSteam turbine CHPElectricity onlyElectricity onlyADIncineration
WaveTidalBiomass
Waste
£300£250£165£165£165£270£270£270£200£270£270£200£200£200£0£100£100£100
3%3%0%0%0%0%0%0%0%0%0%0%0%0%0%3%3%3%
£350£350£180£165£150£270£270£270£200£270£270£180£180£180£0£100£100£100
3%3%0%0%0%0%0%0%0%0%0%0%0%0%0%3%3%3%
The electricity generating mix for the two scenarios are compared to the least cost run inFigure 21. The diverse scenario results in broadly similar levels of PV uptake as in the leastcost scenario, but with a much larger contribution from small systems (less than 100kWe). Inthe flat tariff scenario, the £270/MWh tariff was sufficient to drive significant uptake of100kW+ PV but only small amounts of domestic-scale systems. In the community scenario,over 3.8TWh of electricity is generated from PV in 2020, from 900,000 domestic and 250,000small-scale systems. Small wind turbines, excluding building mounted micro machines, areinstalled in over 40,000 sites and generate 0.8TWh in 2020.
53
Design of Feed-in Tariffs for Great BritainFinal Report
Electricity generation in 2020 - 3.5%scenarios16
Electricity generation in 2020 (TWh)
141210864203.5% least cost3.5% diverse3.5% community
WasteBio
TidalWaveHydroWind (Large)Wind (Small)PV (Large)PV (Small)
Figure 21 Total electricity generation - diverse and community scenarios
Table 19 shows the cost-benefit analysis outputs for the diverse and community scenarios.Increasing the proportion of PV and small wind in the generating mix significantly increasesboth the resource cost and cost to consumers. In the diverse scenario the cumulativeresource cost to 2020 increases to £5.7 billion compared to £3.3 billion in the least costscenario, while the community bias increases it further to £6.7 billion. The cost to consumersin 2020 is slightly lower than the equivalent resource cost, implying negative rents. This isdue to small-scale systems being purchased by consumers who have lower discount ratesthan those used in the assessment of resource costs. These negative rents more than offsetthe positive rents paid to large scale consumers. The annual resource cost per MWhincreases to £106 compared with £68 in the least cost scenario. While the main cause of thisis the deployment of high cost technologies, it is also due to deployment occurring earlier inthe policy lifetime. The additional electricity generated in 2015 (relative to the baseline) is3.5TWh in the community scenario compared to 2.4TWh in the least cost run.Table 19 - CBA outputs - diverse and community scenarios
ParameterAdditional electricity generation in 2015Additional electricity generation in 2020Renewable heat generation in 2020Annual resource cost in 2020Cumulative resource cost to 2020
UnitTWhTWhTWh£m£m
3.5%leastcost2.411.414.27783,284
3.5%diverse3.211.114.39625,769
3.5%community3.511.09.41,1746,71554
Design of Feed-in Tariffs for Great BritainFinal Report
Annual resource cost in 2020Annual cost to consumers in 2020Cumulative cost to consumers to 2020Annual CO2 savings in 2020
£/MWh£m£mMtCO2
681,0444,2744.9
871,0805,6394.8
1061,1596,3094.7
55
Design of Feed-in Tariffs for Great BritainFinal Report
5.3 Degressed tariffsAs described in Section 5.1.3, the fact that that the tariffs in the least cost scenario remainedconstant through time causes the majority of deployment to occur in the latter half of thedecade. This has the effect of lowering both the resource costs and costs to consumers, sincetechnology costs decrease over time. If one of the aims of the Feed-in Tariff is to stimulateuptake from the start of the policy, tariffs must be set high enough to provide attractivereturns for investors even at high technology costs. To prevent excessive rents being paid toinvestors installing systems in the future, the tariff levels must decrease in line withtechnology costs. Modifying tariffs over time can be achieved by reviewing the tariffsperiodically and lowering them to match the decrease in technology costs that have occurredsince the last review. Between the review periods, tariffs could be left unchanged oramended:On an ad-hoc basisBy employing a transparent annual rate of cost reduction such as in Germany, whichsets explicit degression rates for each year between review periods.Although the second method provides investors with certainty over tariff levels, the system isrelatively inflexible since it cannot respond to short term economic changes, like increases intechnology costs, the inflation rate or the cost of debt, which might affect the level ofsupport required to provide attractive returns. To overcome this lack of flexibility, some EUcountries such as the Czech Republic set a ‘floor price’ for each year, so that the tariff will beno less than 95% of the tariff in the previous year. If technology costs rise during the year,the degression rate can be reduced in the following year to prevent a collapse in investordemand.
56
Design of Feed-in Tariffs for Great BritainFinal Report
Costs(£/MWh)
P1Projected technology costsSupport level (£/MWh)
P2
2010
2015
2020
Figure 22 Illustration of degressed versus flat tariffs
Figure 22 illustrates a degressed versus flat tariff for a hypothetical technology. Between2010 and 2020, the levelised costs of the technology are expected to decrease significantly. Atariff is introduced that is degressed each year to match the cost reductions. The supportlevel is initially set at P1 and decreases to P2 in 2015. The degressed tariff will drive uptake inthroughout the policy lifetime since the support level is always higher than the levelisedcosts. The degressed tariff reduces overall subsidy costs substantially compared to a flat tariffheld at P1, since such a tariff would result in large overpayments to investors deployingtechnologies late in the decade. However, a flat tariff set at P2 results in lower costs becauseit reduces uptake between 2010 and 2015 when technology costs are high. Increasing thetariff slightly so that it provides returns for a wider range of site types near to 2020 couldtheoretically deliver the same overall deployment in 2020 at significantly lower costs. Therisk from taking this approach in the design of the Feed-in Tariff is that the low demandbetween 2010 and 2015 fails to drive industry growth and further cost reductions, meaningthat the technology cannot be deployed quickly enough in the second half of the decade tomeet at 2020 target.Table 20 Tariff levels for PV- 2% community scenarios with and without tariff degression
With degressionTechnologyPVSizeDomestic4-10kW10-100kW100-5000kWStand-alone
No degression
Initial tariff Degression Initial tariff Degression(£/MWh)(% per year) (£/MWh)(% per year)£4005%£3000%£3805%£2300%£3505%£2300%£3005%£2000%£3005%£2000%
57
Design of Feed-in Tariffs for Great BritainFinal Report
Table 20 compares the PV tariff levels required for two scenarios that deliver similartechnology mixes in 2020. The first is the 2% community scenario described above; thesecond removes the 5% annual degression for PV and lowers the tariffs so that the overalluptake by 2020 remains the same. As expected, removing degression leads to substantiallyless uptake by 2015, with 90,000 PV installations compared to 350,000. The cumulativeresource costs in 2020 decrease from £4 billion to £2.2 billion. The costs to consumers alsodecrease from £3.3 to £2.2 billion, and there are no negative rents as were found in theoriginal scenario. This implies that the non-degressed tariffs are sufficient to make PVattractive to a wide range of consumers towards 2020, compared with mainly early adoptersin the degressed scenario, so the average hurdle rate of the investors is similar to the 10%discount rate used to assess resource costs.Table 21 Summary Cost Benefit Analysis outputs - 2% community (no degression)
ParameterAdditional electricity generation in 2015Additional electricity generation in 2020Renewable heat generation in 2020Annual resource cost in 2020Cumulative resource cost to 2020Annual resource cost in 2020Annual cost to consumers in 2020Cumulative cost to consumers to 2020Annual CO2 savings in 2020
UnitTWhTWhTWh£m£m£/MWh£m£mMtCO2
2%community2.15.63.96083,9241095063,1282.4
2% communityno degression1.45.53.95272,202964772,1332.4
58
Design of Feed-in Tariffs for Great BritainFinal Report
5.4 Premium tariffsOne of the main distinguishing features between Feed-in Tariffs in European countries iswhether the tariffs are paid instead of or in addition to the market electricity price. A fixedtariff pays renewable generators a single price which leads to the transfer of ownership ofthe electricity to the utility or network operator. In a premium tariff, the generator receivesthe tariff but retains ownership of the electricity, which is then sold on the open market. Adetailed comparison between premium and fixed feed-in tariffs can be found in the report onqualitative design issues prepared by Element Energy and Pöyry. This includes a discussion onthe effects on network infrastructure and balancing and settlement costs that are beyond thescope of the model. The analysis here shows the differences between tariff levels forpremium versus fixed tariffs.An important consideration when assessing likely uptake of renewable technologies underthe two feed-in tariff types is the attitudes of investors to variable payments versusguaranteed. Discussions with a range of investors conducted by Pöyry as part of this projectsuggest that investors’ hurdle rates are likely to be higher for premium tariffs to reflect therisk of total revenues fluctuating due to variability in the market electricity price over time.The mean increase in hurdle rate based on the discussions was one percentage point. Forutilities investing in established technologies such as large-scale wind, the weighted averagecost of capital and hence hurdle rate increases from 8% to 9%. It is assumed that thisincrease applies equally across all investor and technology types in the model.Table 22 shows the tariff levels for the 2% community scenario for fixed and premium tariffs.These tariffs give similar generation mixes in 2020, as shown in Figure 23. Tariffs for large-scale technologies are £50/MWh lower in the premium tariffs, while small-scale installationsreceive on average £100/MWh less. The difference between the fixed and premium tariffs isroughly equivalent to the market electricity price paid to the investor. For large-scaletechnologies which export their entire output to the grid, this is equal to the wholesale price,which varies between £50 and £60 per MWh in DECC’s central fuel price estimate. For small-scale technologies whose output is partially used on-site, the average price assumed in themodel is the weighted average of the retail and export price. In practice however, due to thefact that small generators provide only small amounts of electricity to the grid, they mayhave difficulty in securing the same wholesale price for exports that a large-scale generatorcan access, and may receive a much lower price. As described in Section 3.6, small-scaletechnologies are assumed to export 50% of their output, while larger systems are assumed toexport their entire output to the grid.
59
Design of Feed-in Tariffs for Great BritainFinal ReportTable 22 Tariff levels for the 2% community scenario - fixed and premium tariffs
Fixed tariffTechnologyPVSizeDomestic4-10kW10-100kW100-5000kWStand-aloneMicro1-15kW15-50kW50-250kW250-500kW500-3000kW1-10kW10-50kW50-500kW500kW+All typesAll typesHeat turbineORCSteam turbineCHPElectricity onlyElectricity onlyADIncineration
Premium tariff
Wind
Hydro
WaveTidalBiomass
Initial tariff Degression Initial tariff Degression(£/MWh)(% per year) (£/MWh)(% per year)£4005%£3005%£3805%£2605%£3505%£2305%£3005%£2005%£3005%£2005%£2000%£1500%£3000%£2500%£2500%£2000%£2000%£1500%£1800%£1300%£1430%£830%£1450%£950%£1450%£950%£1400%£900%£1400%£900%£2502%£2002%£2500%£2000%£1300%£800%£1300%£800%£130£0£100£100£1000%0%0%0%0%£80£0£50£50£500%0%0%0%0%
Waste
60
Design of Feed-in Tariffs for Great BritainFinal Report
Electricity generation in 2020 - Fixed versuspremium tariffs9
Electricity generation in 2020 (TWh)
8765432102% community2% community premium
WasteBio
TidalWaveHydroWind (Large)Wind (Small)PV (Large)PV (Small)
Figure 23 Electricity generation for the 2% community scenario - fixed versus premium tariffs
Table 23 shows the summary CBA outputs for a fixed and premium tariff based on the 2%community scenario. The overall generation in 2020 is similar for the two designs, but the2015 generation is 0.3TWh lower. This is because in the DECC central fossil fuel pricescenario, electricity prices rise between 2010 and 2020. In a fixed tariff design, investors areprotected from variation in the electricity price by definition, whereas the total revenueunder a premium tariff rises with increases in electricity prices. Degression rates must bemodified under premium tariffs since they affect the premium payment rather than the totalrevenue. For example, if the total revenue was split equally between the tariff and themarket electricity rate and the technology cost reduction was 5% per year, the tariff wouldhave to be degressed by 10% at the end of the first year to maintain the same rate of return.In the example given below, degression is not applied to the premium tariff, which delays thedeployment of high-cost technologies. This leads to a significant reduction in the cumulativeresource cost of £600 million by 2020.Table 23 Summary CBA outputs - fixed versus premium tariffs
ParameterAdditional electricity generation in 2015Additional electricity generation in 2020Renewable heat generation in 2020Annual resource cost in 2020Cumulative resource cost to 2020
UnitTWhTWhTWh£m£m
2%community2.15.63.96083,924
2% communitypremium1.85.63.95993,31361
Design of Feed-in Tariffs for Great BritainFinal Report
Annual resource cost in 2020Annual cost to consumers in 2020Cumulative cost to consumers to 2020Annual CO2 savings in 2020
£/MWh£m£mMtCO2
1095063,1282.4
1085723,0522.4
62
Design of Feed-in Tariffs for Great BritainFinal Report
5.5 Effect of tariff lifetimeAll of the scenarios above assume that tariff payments are paid for the duration of theproject life at the initial rate. For a large wind turbine, this means that tariff payments will bemade 20 or 25 years after the system is installed. Since future payments are discounted byapproximately 10% per year for an average large-scale investor, the present value ofpayments made in the 25th year of the project are very low. For example, a Feed-in Tariffpayment of £1000 made in year 25 has a present value of only £71 when discounted at 10%per year. This suggests that paying the tariffs over a period shorter than the technologylifetime could significantly reduce the total subsidy required to make the investmentattractive for a given consumer. In the extreme case where the tariff was capitalised and paidup front to investors at the time of purchase it could help to overcome the capital costbarriers that may prevent domestic consumers from installing technologies even where thelong term rate of return is positive. Deeming and capitalisation of tariffs is discussed in thecontext of consumer finance below.Table 24 shows the effect of changing the tariff lifetime on the total subsidy cost. In eachcase, the present value of the tariff payments to the investor is constant when assessed at adiscount rate of 10%. For a tariff of £100 per year paid over 25 years, the present value to theinvestor is £908 at a discount rate of 10% per year. The present value of the tariff to thegovernment, which discounts future payments at the Green Book discount rate of 3.5%, is£1,648. This assumes that although tariff payments will be passed on to electricity consumersrather than borne by government directly, the social discount rate is still used whenassessing the present value of future costs and benefits. If the tariff payment period isreduced from 25 years to 10 years, the annual tariff required to provide the investors withthe same overall value is £148. The present value of this higher tariff to government whenpaid over 10 years is £1,229, 25% lower than for a lifetime tariff. For a tariff paid over fiveyears the difference is even greater and the reduction in total subsidy cost is 34%Table 24 Effect of tariff lifetime on subsidy costs
Investor discount ratePayment period (years)Annual payment (£)Present value of payments (investor discountrate)Present value of payments (Green Bookdiscount rate)
Lifetime5 year10 year15 yeartarifftarifftarifftariff10%10%10%10%2551015£100£239£148£119£908£1,648£908£1,081£908£1,229£908£1,37463
Design of Feed-in Tariffs for Great BritainFinal Report
% reduction in lifetime subsidy cost (at GreenBook discount rate)
0%
34%
25%
17%
The benefit of reducing tariff lifetimes depends on the importance placed by investors on up-front versus ongoing revenue. The saving in total tariffs paid to an investor is greatest wherethat investor has a high discount rate. Figure 24 shows the effect of changing consumerdiscount rates on the cost saving of a 10 year versus 25 year tariff. For an investor with a 10%discount rate, the total value of tariffs paid over a 10 year tariff, when assessed at the socialdiscount rate of 3.5% is £1,230. For a domestic investor requiring very short paybacks anddiscounting future payments by 20% per year, the total value to the government is only£908. This is a saving of 40% relative to the lifetime tariff. However, for early adopters whoserate of time preference is similar to the social discount rate of 3.5%, there is no benefit toreducing tariff lifetimes. This implies that where domestic systems are purchased primarily byearly adopters, there may be limited benefit to paying tariffs over a shorter period.£2,500
Present value (discounted at 3.5%)
£2,000
£1,500Present value of payments(lifetime tariff)Present value of payments (10year tariff)
£1,000
£500
£00%3.50%10%20%
Consumer discount rate
Figure 24 Cost saving of shorter tariff lifetimes at different investor discount rates. The present value ofpayments is assessed using the social discount rate of 3.5%.
The main advantage of paying tariffs over the lifetime of renewable energy technologies isthat is maximises the incentive to maintain the performance of the system for the wholeperiod. Where tariff periods are reduced, or if the tariff is capitalised and paid at the time ofpurchase, this incentive is reduced. For example, if a fixed tariff was paid over ten yearswhich included payment for the electricity the system would produce over the wholelifetime, the investor would receive no revenue between years ten and twenty five. Theinvestor would then have no incentive pay for maintenance costs, for example a replacementinverter for a PV system, if it occurred after year ten. For this reason, it is suggested that64
Design of Feed-in Tariffs for Great BritainFinal Report
tariffs paid over a period shorter than equipment lifetimes should be premium tariffs, paid ontop of the electricity price. While this slightly reduces the benefit in terms of reducing totalsubsidy costs, it provides a continuing incentive in terms of the market electricity price formaintaining equipment for its useful life.A special case exists for CHP technologies, where the biomass or gas fuel cost may form alarge part of the electricity generating cost. In this case, a premium tariff paid over a shortperiod may not provide incentive to maintain the plant in the long term if the marketelectricity price alone cannot cover the variable costs of operating it.
65
Design of Feed-in Tariffs for Great BritainFinal Report
5.6 Tariffs based on rate of returnThe analysis above shows that different combinations of tariff levels and degression rates candeliver a wide range of technology mixes for a given electricity generation target. This hassignificant implications for policy costs, and other benefits such as job creation andcommunity engagement. To set tariffs to deliver a certain range of technologies requiredgovernment to define a number of objectives for the policy, such as the balance betweenminimising the impact on consumer electricity bills and encouraging domestic consumers toinstall renewable technologies. An alternative approach to decidinga prioriwhat the desiredpolicy outcomes should be is to set tariffs in such a way that they provide an equal rate ofreturn to all technologies at all scales. This allows all technologies to ‘compete’ forinvestment on equal terms, and is likely to result in a wide range of technologies beingadopted. This is the approach employed by Germany in the design of its Feed-in Tariff, whichaims to provide a rate of return of between 5 and 7%.To simulate this approach, tariffs levels were set to provide a fixed rate of return to alltechnologies and all scales. For example, to provide an 8% return, the tariffs were set equalto the levelised cost of energy (defined as annual capital repayments and operating costsdivided by annual energy production), assessed using a cost of capital of 8%. In addition,tariffs were set to provide equal returns to technologies installed at different sites, so thatlarge wind turbines installed at windy sites receive the same returns as those in less optimalsites. For technologies whose generating costs decrease over time, the tariffs match thatreduction to maintain a constant rate of return over time. Note that this approach cannot beimplemented in practice since it assumes perfect knowledge of the costs of generation acrossall technologies, scales and years. In practice, a smaller number of tariffs would be used toprovide the desired rate of return to an ‘average’ installation, and the support received atspecific sites may be slightly lower or higher than this amount.Table 25 shows the fixed tariff levels required to provide a given rate of return to eachtechnology in 2010. Tariffs for wind depend on wind speed and the values in the tableassume an annual mean wind speed of 6.5 m/s. The values for biomass CHP are based on thecosts of a standalone system rather than one connected to a district heating network.Table 25 Tariff levels in 2010 (£/MWh) for a range of rates of return
TechnologyPV
SizeDomesticMediumLarge
8%£590£454£423
10%£685£530£493
12%£785£610£567
12%community, 8%large-scale£785£610£42366
Design of Feed-in Tariffs for Great BritainFinal Report
Wind
HydroWaveTidalBiomass CHP
Waste
MicroSmallMediumLargeSmallLargeAllAllHeat turbineORCSteam turbineAll
£1,000£237£151£93£240£142£233£206£236£258£185£90
£1,106£269£170£104£274£159£271£234£254£280£198£100
£1,217£304£190£116£311£178£310£264£272£303£212£110
£1,217£304£151£93£311£142£233£206£236£258£185£90
Figure 25 shows the amount of electricity generated by sub-5MW technologies in fourconstant rate of return scenarios. In the first three, investors receive a return on investmentof 8%, 10% or 12%, independent of technology, size or site type. In the fourth, investors incommunity-scale technologies receive a higher rate of return of 12%, while large-scaleinvestors receive returns of 8%. For the purposes of this scenario, community scale includesdomestic systems and is defined as PV systems with peak power outputs less than 100kW,wind systems less than 250kW and hydro projects less than 100kW.
Electricity generation in 2020 - Fixed rateof return30
Electricity generation in 2020 (TWh)
25
WasteBio
201510508% ROI10% ROI12% ROI12% communityROI
TidalWaveHydroWind (Large)Wind (Small)PV (Large)PV (Small)
Figure 25 Electricity generation in 2020 - constant rate of return scenarios
At a rate of return of 8%, there is no investment in technologies by developers or utilitiessince 8% is equal to the minimum point on the hurdle rate distribution for these investors.67
Design of Feed-in Tariffs for Great BritainFinal Report
Domestic consumers and commercial building owners have minimum hurdle rates of 3% and6%, respectively, so there is a substantial portion of the population willing to invest at 8%.Over 5TWh of domestic and small-scale PV are installed by 2020, equivalent to 1.7 millioninstallations. Micro-wind turbines are installed in over 800,000 sites, although the tariffrequired to provide an 8% rate of return is substantially higher than domestic PV, at£1000/MWh. Of the large scale technologies, over 3.5TWh of biomass CHP is installed by2020. All of these installations are commercial or industrial systems serving heat loads on-site. There is no uptake of district-heating connected systems since these are assumed to befunded only by developers or utilities whose hurdle rates exceed 8%.Increasing the rate of return to 10% leads to a total electricity generation in 2020 of 25TWh.There is widespread uptake of large scale technologies by developers and utilities, but PV isthe dominant technology with nearly 14TWh of generation by 2020. This reflects the verylarge technical potential of PV, which can be deployed relatively quickly given sufficienteconomic support. However, over half of the capacity is from installations above 100kW,with 3.5GW of large stand-alone systems installed by 2020. At a rate of return of 10%, mosttechnologies are being deployed at their maximum rate, given supply and demand sideconstraints. Hence increasing the rate of return to 12% only delivers another 2TWh ofgeneration. A community-based tariff which offers a higher rate of return to community-scale projects as defined above delivers 15TWh of renewable electricity a year in 2020, withover two-thirds of this generated by PV systems.Table 26 shows the summary cost benefit analysis outputs for the four scenarios. Despite thetotal electricity generation in the 8% ROI being 3TWh less than in the 3.5% scenarios, thetotal policy costs are significantly higher than both diverse and community scenarios. This isbecause there is no contribution from large-scale technologies from developers and utilitiesat an 8% rate of return, so the generation is exclusively from high cost, small-scaletechnologies. The resource cost per MWh in 2020 is £204, compared with £110 in the 3.5%community scenario. At a 10% rate of return the cumulative resource cost and cost toconsumers are both £12.5 billion, with an annual spend of over £3 billion in 2020. Rents arenegligible in the 10% scenario since the rate of return used to set the tariff levels is equal tothe discount rate used to assess resource costs, and the tariffs closely match changes in costsacross time and different sites. The resource cost per MWh is lower than in the 8% scenariosince there is widespread deployment of low-cost, large technologies.A policy design that offers higher rates of return to domestic and community-scale projectsand relatively low rates to businesses has a higher total subsidy cost than a scenario offering10% returns to all investors, while delivering only 60% of the electricity generation. The costper MWh is higher for this scenario than if all investors were offered the same 12% rate ofreturn, since the policy has failed to drive uptake of the lowest cost measures.
68
Design of Feed-in Tariffs for Great BritainFinal ReportTable 26 Summary CBA outputs - fixed rate of return scenarios
ParameterAdditional electricity generation in 2015Additional electricity generation in 2020Renewable heat generation in 2020Annual resource cost in 2020Cumulative resource cost to 2020Annual resource cost in 2020Annual cost to consumers in 2020Cumulative cost to consumers to 2020Annual CO2 savings in 2020
UnitTWhTWhTWh£m£m£/MWh£m£mMtCO2
8%ROI1.48.011.41,6258,0972041,3686,8483.4
10%ROI3.423.07.23,23312,5521413,18712,3599.9
12%ROI3.825.27.53,58213,5361424,19515,76210.8
12%communityROI1.514.511.42,76210,9351903,20612,5936.2
The analysis above suggests that for a policy design based on offering constant rates ofreturn, trying to minimise resource and policy costs in terms of £/MWh by reducing the rateof return offered will have the opposite effect. This is due to the relatively large number ofsmall-scale consumers who are willing to accept lower rates of return than commercialentities but who only have access to the highest cost technologies. Another significantchallenge of this approach is ensuring that all investors receive the intended rate of return,especially for technologies whose costs are highly time- and site-dependent. This requiresboth degression of tariffs, and a mechanism to minimise rents for low-cost projects whileproviding a sufficient incentive for those at less optimal sites.
69
Design of Feed-in Tariffs for Great BritainFinal Report
5.7 Interaction between the feed-in tariffs and the Renewable HeatIncentiveIn all of the scenarios described above, biomass makes a significant contribution to theelectricity generation target. The biomass technologies in the model are all able to operate aselectricity only or combined heat and power (CHP) plants, and the design of the feed-in tariffis critical in determining whether waste heat from the plants is utilised. Electricity-only plantsare likely to have significantly lower costs per MWhethan CHP plants due to the cost ofconnection to a heat distribution network, either within a building or between buildings inthe case of district heating. In addition, extraction of heat from a steam cycle reduces theelectrical efficiency of the plant, which leads to lower feed-in tariff revenues for a given fuelinput.Despite lower costs, electricity-only biomass plants are an inefficient use of the biomassresource compared to CHP plants, which have overall efficiencies of over 70%. Due to thenature of the turbines used in sub-5MW plants, the electrical efficiency is significantly lowerthan in a gigawatt-scale fossil fuel power station. In other words, if the biomass resource is tobe exploited solely for the production of electricity, it should be co-fired in large centralisedplants (at 40% efficiency), rather than in decentralised electricity-only plants with anefficiency of only 25-30%.At current technology costs, the additional expense in utilising waste heat from a biomassplant is not recouped through heat sales over the life of the plant. This is especially true if thecosts of consumer connections to a district heating network are included in the project cost.This means that a feed-in tariff offering the same support to biomass technologies whetheror not the waste heat is utilised will encourage deployment of electricity-only plants. If this isto be avoided, the policy must be designed to provide additional revenue to CHP plants. Thiscan be achieved in the following ways:1. Excluding electricity-only biomass from the list of technologies eligible to receive thefeed-in tariff. Sub-5MW plants will remain eligible for support under the RenewablesObligation.2. Setting support levels so that plants utilising waste heat receive a higher tariff. This isdelivered through the feed-in tariff, so each MWh ofelectricityis rewarded morehighly by CHP plants.3. Setting equal tariffs for plants irrespective of heat use and providing an additionalincentive for heat use through the Renewable Heat Incentive. The feed-in tariff is setat such a level that it doesn’t provide attractive returns to plants without the RHIsupport, thus minimising deployment of electricity-only plants.
70
Design of Feed-in Tariffs for Great BritainFinal Report
Method 2 is similar to the support provided to biomass under the Renewables Obligation,where plants receive an additional 0.5 ROCs subject to meeting criteria on the use of wasteheat. For plants with a heat to power ratio of three to one and at a ROC price of £45/MWh,this support is equivalent to £7.50 for each MWh of heat delivered.For simplicity, electricity-only biomass is specifically excluded from the main model runsdescribed above. These plants receive revenue equivalent to the market electricity price plus1 ROC. CHP only biomass receives the Feed-in Tariff as well as a Renewable Heat Incentive foreach MWh of heat delivered. The value of the RHI is £10/MWhth, and is assumed to remainconstant throughout the life of the policy. This is similar to the premium of 0.5ROCs perMWh offered to biomass plants under the banded Renewables Obligation. The level ischosen to illustrate Method 3 above, and does not reflect the Government’s position onsupport levels under the Renewable Heat Incentive. For simplicity, biomass plants receive thesame heat incentive whether the heat is used on-site or fed in to a district heating system.Table 27 shows the effect of offering a Feed-in Tariff to electricity-only biomass. In the firstscenario, a Feed-in Tariff of £155/MWheis offered to all biomass CHP plants, regardless oftechnology type or site. A further £10/MWhthis offered in the model under the RenewableHeat Incentive. Electricity-only biomass does not receive support under the FIT. There arenearly 1,900 CHP plants installed by 2020 under this scenario, generating 2.8 TWh ofelectricity, and no uptake of electricity-only plants. In the second scenario, electricity-onlybiomass is offered a fixed feed-in tariff of £155 per MWhe, the same as biomass CHP, while inthe third scenario the electricity-only tariff is lowered to £120/MWh. A £155/MWh issufficient to make electricity-only plants an attractive investment, with 88 3MWeinstalled by2020. Providing a tariff to electricity-only plants reduces uptake of CHP plants over the policylifetime. This is due to the fact that the overall uptake of biomass technology is constrainedby maximum growth rate of the industry. This leads to some of the market capacity being'allocated' to electricity-only projects, which provide attractive returns and do not share thesame heat demand constraints with CHP plants.Table 27 Biomass electricity scenarios
Cumulative installations by 2020 (CHP)Cumulative installations by 2020 (elec. only)GWh generated in 2020 (CHP)GWh generated in 2020 (elec. only)
2% flattariff1,87802,8330
£155/MWhfor biomasselectricity648889951,839
£120/MWh forbiomasselectricity1,082531,7181,116
Reducing the biomass-electricity tariff to £120/MWh, while maintaining support for CHPplants at £155/MWh, causes CHP plants to be the dominant biomass technology in 2020,71
Design of Feed-in Tariffs for Great BritainFinal Report
with 1.7TWh of electricity generated compared to 1.1TWh from electricity-only plants. In thisscenario, the difference in support between CHP and electricity-only plants is £35/MWhefrom the Feed-in Tariff plus £10/MWhthfrom the RHI. The total difference in support for asteam turbine (with a heat to power ratio of 2.5 to 1) is £60/MWhe. This suggests that theextra half ROC available to CHP plants under the RO is not sufficient to discourage theinstallation of electricity-only plants in the majority of applications. This assumes that theentire cost of heat distribution is borne by the CHP project developer. If the costs of heatnetworks, particularly for district heating, were reduced by another policy mechanism suchas low cost loans or grants, this would reduce the amount of support required for the plantunder the FIT or the RHI.
72
Design of Feed-in Tariffs for Great BritainFinal Report
5.8 Gas-fired CHPIn addition to providing support to renewable electricity technologies, the Feed-in Tariff willprovide a tariff to gas-fired CHP with peak capacities up to 50kWe. Although not strictly arenewable technology, good quality gas CHP offers significant CO2reductions relative to gasboilers and grid electricity due to higher overall efficiencies. The costs of gas-fired CHP arehighly site-specific, and 50kWesystems in high run hours locations can already beeconomically attractive under current policies and fuel prices. However, at the domesticscale, Stirling engines and fuel cells are not yet available in commercial quantities and capitalcosts are significantly higher than the incumbent condensing boiler.Since domestic CHP systems are currently under development and not yet available incommercial quantities, there is considerable uncertainty over the long term costs, as wellas CO2savings, of these technologies. The results below show the costs of widespread CHPuptake, under the assumption that costs decrease in line with industry expectations (asshown in Appendix 1).Table 28 shows the uptake of gas-fired CHP under the baseline, which does not includeexplicit support for the technology. Systems are assumed to receive the wholesale electricityprice for power exported to the grid, and on-site consumption is valued at the relevantimport price. Overall uptake by 2020 is low for all technologies, with fewer than 2,000commercial systems installed. Fuel cell CHP is installed in over 140,000 homes, with over 70%of this uptake occurring in 2019 and 2020. Due to its relatively low electricity generation,Stirling engines do not provide attractive returns to domestic consumers without additionalpolicy support8.Table 28 Gas-fired CHP uptake under the baseline
TechnologyStirlingFuel cell10kW gas50kW gas8
CumulativeMW installedGWh electricity generatedinstallations in 2020 capacity in 2020in 2020000146,83514773085595199049297
It should be noted that these results differ slightly from the baseline results in the 2008 ElementStudy on the Growth Potential for Microgeneration. The baseline in that model included support fromelectricity suppliers under CERT and the post-2011 supplier obligation, which is critical in ensuringuptake between 2010 and 2020 while technology costs decrease. The model developed for that studyalso includes a large number of building types to provide a better representation of the UK buildingstock. The consumer behaviour model in that study is also more suitable for domestic consumers,since it allows consumers to ‘choose’ between competing technologies such as gas boilers, heatpumps and biomass systems. Readers seeking a more detailed analysis of domestic scale CHP arereferred to that report, available athttp://www.berr.gov.uk/energy/sources/sustainable/microgeneration/research/page38208.html
73
Design of Feed-in Tariffs for Great BritainFinal Report
Total
148,680
148,680
148,680
In the following scenarios, a fixed feed-in tariff was applied to all gas-fired CHP. The tariffsare differentiated by technology but not site type, so a fuel cell installed in a new build homereceives the same support per MWh of electricity as one installed in an older property. In thefirst scenario a flat tariff of £155/MWh is offered to gas-CHP. When the same tariff is offeredto all sub-5MW renewables, as described in Section 5.1.1, approximately 8TWh of generationis delivered by 2020. Table 29 shows uptake of gas-fired CHP under the fixed tariff. The tariffdelivers 5 million CHP systems by 2020, with nearly 2.5 million units each for Stirling enginesand fuel cells. The total generating capacity is nearly 6GW, producing 22TWh of electricity in2020. This is equivalent to over 5% of projected UK electricity demand in that year.Table 29 Uptake of gas-fired CHP under a £155 fixed tariff
TechnologyStirlingFuel cell10kW gas50kW gasTotal
Cumulative installationsMW installed capacityGWh electricityin 2020in 2020generated in 20202,452,5032,4537,2612,449,1042,44911,74941,5374151,70811,0835541,9194,954,2265,87122,637
The summary CBA outputs for the flat tariff are shown in Table 30. The total electricitygeneration relative to the baseline increases from 3TWh in 2015 to 21.6TWh in 2020,suggesting that the majority of uptake occurs in the second half of the decade. Thecumulative resource cost in 2020 is nearly £5 billion, but the cost per MWh of £61 issignificantly lower than scenarios involving widespread deployment of domestic scalerenewables, where the resource cost can exceed £100/MWh. The cumulative cost toconsumers is £1 billion lower than the cumulative resource cost, suggesting significantnegative rents. This is because although 5 million domestic CHP units is a high number, it isonly 25% of the total suitable housing stock. This means that consumers with relatively lowhurdle rates (lower than the 10% cost of capital employed in the cost benefit analysis) aremaking the majority of the investments. The annual CO2savings of 3.3Mt in 2020 includes anallowance for the carbon content of the gas input.Table 30 Summary CBA outputs - £155/MWh flat tariff for CHP
ParameterAdditional electricity generation in 2015Additional electricity generation in 2020Renewable heat generation in 2020
UnitTWhTWhTWh
Value3.021.60.074
Design of Feed-in Tariffs for Great BritainFinal Report
Annual resource cost in 2020Cumulative resource cost to 2020Annual resource cost in 2020Annual cost to consumers in 2020Cumulative cost to consumers to 2020Annual CO2 savings in 2020
£m£m£/MWh£m£mMtCO2
1,3274,784611,1033,8893.3
The levelised cost of electricity from medium-scale CHP is expected to remain relativelyconstant over time, since reciprocating gas engines are a mature technology with a largeinstalled base. However, costs of Stirling engines and fuel cells are expected to decreasesubstantially as manufacturing techniques improve and supply chains mature. For example,the levelised cost for fuel cell CHP in a high run hours application decreases from £277/MWhein 2010 to £135/MWhein 2020. This suggests that a tariff with a built in degression ratewould lead to increased uptake in the early years of the policy without causing large rents ascosts decline towards 2020. Table 31 shows a possible degressed tariff for Stirling enginesand fuel cells. At a degression rate of 5% per year, an initial tariff of £240/MWhedecreases to£144/MWh in 2020.Table 31 Degressed tariff levels for gas-fired CHP
TechnologyDomestic StirlingDomestic Fuel CellGas Engine (10kW)Gas Engine (50kW)
Degression rate Tariff in 2010 Tariff in 2015Tariff in 20205%£240£186£1445%£240£186£1440%£155£155£1550%£155£155£155
The summary CBA outputs for the flat and degressed tariffs are compared in Table 32. Themain conclusion is that paying higher tariffs at the beginning of the policy does not result inmore installations by 2015. This is because the industry is already growing at its maximumrate under the flat tariff. Fuel cell CHP is not expected to be widely available before 2011-12,so in 2015 the maximum number of installations is only 100,000 even at high tariffs. A similarconstraint exists for Stirling Engines.Although the deployment profile and hence generation and resource cost figures look similarfor the flat and degressed tariffs, the cumulative cost to consumers by 2020 is over £1 billionhigher for the degressed tariff. This suggests that for novel technologies whose initial uptakeis heavily constrained on the supply side, there is no benefit to paying higher tariffs in theearly years of the policy. As long as the lower tariff still leads to sufficient investors to allowthe industry to grow, paying high tariffs will not deliver any additional deployment eventhough the number of willing investors increases. This means that the higher tariffs are
75
Design of Feed-in Tariffs for Great BritainFinal Report
simply rents for the investors who would have been willing to invest at a lower level ofsupport.Table 32 Summary CBA outputs - degressed tariffs for small CHP
ParameterAdditional electricity generation in 2015Additional electricity generation in 2020Renewable heat generation in 2020Annual resource cost in 2020Cumulative resource cost to 2020Annual resource cost in 2020Annual cost to consumers in 2020Cumulative cost to consumers to 2020Annual CO2 savings in 2020
UnitTWhTWhTWh£m£m£/MWh£m£mMtCO2
Flat tariff3.021.60.01,3274,784611,1033,8893.3
Degressed tariff3.021.20.01,3134,877621,1664,7383.2
The result described above would support setting a flat tariff for CHP for the first few years ofthe policy. The tariff would be set so that it provides attractive returns only to a limited poolof investors, and technology cost reductions would increase the number of investors in linewith the ability of the industry to meet the demand. As well as creating maximum certaintyfor the industry, this approach eliminates the need to set an explicit degression rate for anovel technology whose cost reduction rate is highly uncertain. Once the technology reachesmeaningful levels of deployment, the tariff levels can be reviewed and an annual degressionrate set to reflect further reductions in the system costs. Although a feed-in tariff is likely tobe the best option for driving widespread deployment of micro-CHP in the medium to longterm, the technology may benefit from alternative or additional support during the earlystages of commercialisation. Such support could include grant funding under a post-2011Supplier Obligation, or an alternative programme. Grant support paid upfront would helpconsumers to overcome the high capital cost barrier that is likely to be present for earlysystems. Once capital costs have decreased, a Feed-in Tariff would then provide a continuingincentive for high-performance systems that generate significant quantities of electricityeach year.
76
Design of Feed-in Tariffs for Great BritainFinal Report
6 ConclusionsThe analysis suggests that there is a very large technical potential of sub-5MW renewableelectricity in the UK. The total resource is 130 TWh per year, with PV and biomass CHPcontributing over 100TWh to this target. There is also a very large sub-50kW gas-fired CHPresource of nearly 90TWh per year. Taken together, this potential is equivalent to nearly halfof UK electricity generation. The majority of this potential is not currently economic andcannot be delivered without large subsidies. When additional market and social barriers areconsidered, the actual potential that can be delivered each year is much lower, but stillrepresents a meaningful contribution to UK electricity supply. A tariff design that encouragesuptake across a range of technologies and scales can deliver 10-15TWh per year ofrenewable electricity in 2020, with an additional 20TWh from sub-50kW gas CHP.The other main conclusions from this study are as follows:A 2% generation target can be achieved at relatively low cost using mega-watt scaletechnologies. The cumulative resource cost by 2020 is £1.0 billion higher thanbusiness as usual. Diversifying the technology mix to include domestic-scale PV andwind comes at a high cost, with the cumulative resource cost in 2020 increasing to £4billion.For a policy aiming to drive uptake of a wide range of technologies, setting a flattariff leads to significant over payments to low-cost large scale generators. Bandingtariffs by technology can lead to significant reductions in subsidy costs whilemaintaining the same overall generation. The importance of banding increases withincreasing technology diversity, since the differences in costs between technologiesbecomes larger than differences within technologies (for example large windturbines at different wind-speed sites).Increasing the generation target to 3.5% of the UK electricity demand significantlyincreases the cost to the country by 2020, from £1 billion to £4 billion for the leastcost scenarios. A 3.5% least cost scenario results in significant uptake of small-scaletechnologies, with over 3TWh of electricity per year generated from PV and smallwind. This is because for ambitious targets, large-scale technologies cannot bedeployed quickly enough to meet the target by 2020.For technologies whose costs are expected to decrease over time, reducing tarifflevels each year is necessary to avoid overpayments to investors making investmentsin the second half of the next decade. However, matching tariff levels to technologycosts from the first year of the policy results in significantly higher policy costs thansetting a flat tariff so that the technology is only deployed when its costs decrease. In77
Design of Feed-in Tariffs for Great BritainFinal Report
other words, there is a financial benefit to delaying uptake until technologies arecheaper. The risk of this approach is that if consumer demand is low for the first fewyears of the policy, the industry will not make the investments necessary to deliverlarge amounts of renewable energy at low cost towards 2020.Premium tariffs, where tariff payments are made on top of the market electricityprice, carry a higher risk than a fixed tariff with an equivalent total support level, dueto volatility of electricity prices. This additional risk is likely to be reflected in a highercost of capital for projects and higher hurdle rates. This means that overall supportmust be higher under a premium tariff to encourage a given level of uptake.In the results above, it is assumed that tariffs are paid over the lifetime of thetechnology. Where investors employ high discount rates and place a low financialvalue on revenues received in the distant future, total subsidy costs can besignificantly reduced by paying tariffs over a shorter period. For example, for aninvestor with a 10% discount rate, a 10 year tariff that provides the same perceivedvalue as a 25 year tariff has a 25% lower lifetime subsidy cost (assessed at the socialdiscount rate of 3.5%).The benefit of paying tariffs over a shorter period is highly sensitive to the way inwhich investors value long term benefits. For an early adopter with a similar discountrate to the social discount rate, there is no benefit to paying tariffs over a shorterperiod. For investors with very high discount rates, such as many domesticconsumers, costs can be reduced by paying tariffs up-front at the point of purchase(capitalisation). The risk of this approach is that the investors has less incentive tocontinue to operate the system after the majority of the tariff has been paid. Inaddition, capitalisation requires the energy output of each system to be ‘deemed’(estimated), and would require additional verification that the device actuallydelivered the electricity that it was predicted to do.Setting tariffs to provide an 8% rate of return for all technologies encourages uptakeof small-scale, higher cost technologies but does not stimulate deployment of large-scale systems. This is because there is a significant proportion of domestic investorswho are willing to accept returns of 8% or less, but the majority of large-scaleinvestors have hurdle rates above 8%.The treatment of electricity from biomass must be considered carefully in the designof the Feed-in Tariff. A tariff structure that fails to provide additional incentives forplants utilising waste heat is likely to encourage the construction of electricity-onlyplants. This is an inefficient use of biomass compared to CHP plants and co-firing ingigawatt-scale electricity plants. A premium of £10/MWhth, similar to the additional0.5 ROCs per MWhepaid to CHP plants under the RO, is sufficient to encourage useof waste heat in on-site applications. However, higher support is required to78
Design of Feed-in Tariffs for Great BritainFinal Report
encourage deployment of plants connected to district heating networks due to thehigh additional costs involved. This higher support could be provided through theFeed-in Tariff, the Renewable Heat Incentive, or other policy support such as low-cost finance or grants for the construction of the heat distribution networks.There is a very large potential for gas-fired CHP available at relatively low cost. A flattariff of £155/MWh, equivalent to the market electricity price plus the 2 ROCs perMWh currently paid to renewable microgenerators, delivers nearly 22TWh of CHPelectricity by 2020. The annual CO2savings from gas-fired CHP in that year are over 3million tonnes. However, the majority of this potential is from domestic-scale deviceswhich are not currently available in commercial quantities. As a result there is someuncertainty over the long term costs of these technologies.A flat tariff of £155/MWh for gas-fired CHP has significantly lower subsidy costs thanan initial tariff of £240/MWh degressed at 5% per year. This is because uptake isinitially constrained by the ability of the industry to ramp up production capacity.Paying higher initial tariffs results in overpayments to investors who were willing toinvest with lower support levels, while failing to deliver any additional deployment.This supports holding tariffs at the same level for the first few years of the policy,before introducing degression to match any further cost reductions.
79
Design of Feed-in Tariffs for Great BritainFinal Report
7 Appendix A - Technology cost and performance assumptionsTechnology cost projection assumptions form a key input into the Feed in Tariff model. Thisappendix outlines proposed costs for the period 2009–2030.Approach to technology costingFor smaller systems, the technology capital costs are represented using fixed and marginalelements. The fixed value is capacity independent and represents fixed costs per installationsite. The marginal element is size dependent based on £/kW. When sizing systems, thisallows for size independent elements (e.g., electrical installation) to be costed separatelyfrom size dependent (e.g. PV area), as illustrated in Figure 26.Fixed costs are typically a high percentage of the overall costs where small one-off systemsare installed. For larger systems, technology capital costs have simply been represented as acost per kW installed.
Figure 26 Representation of fixed and marginal costs
For any given technology, in any year, costs will vary with size of installation. Over timetechnologies are also predicted to experience a learning rate, which relates growth (orcumulative capacity) with a set percentage reduction in cost. For many technologies, thelearning curve methodology theory has been realised in practice. For example, historical PVcosts follow a learning rate of 18%. This means that every doubling of capacity/production isaccompanied by an 18% reduction in capital cost.80
Design of Feed-in Tariffs for Great BritainFinal Report
Where significant reductions in capital cost are predicted, these projections are based onlearning curve analysis, details of which can be found in the original BERR MicrogenerationStudy appendices and the Potential for Microgeneration: Study and Analysis.9Inflation is considered to be 0% throughout the study for simplicity. The incumbent isassumed to be the national grid unless otherwise stated.Maintenance costsMaintenance costs may increase or decrease depending on wage rates, the uptake oftechnologies (and therefore number of local installers) and the maturity of technology; forexample, whilst technology maturity may reduce costs, this could be countered by increasingrates due to skills shortages.Feedback effectsIt is recognized that there are a number of feedbacks which are likely to impact the cost of aparticular technology in the UK. For example, an increase in UK installed capacity may lead toan improvement in installation methods or more skilled installers, driving down the totalcost, which in turn may increase sales further.Cost reductions for the technologies themselves are likely to be linked to the global market,since the UK is a relatively small proportion of global demand. However, costs associatedwith installation are likely to be driven more strongly by UK demand. An additionaldistinction is made between time-dependent and volume-dependent learning rates.Exchange rateThe exchange rate between Euros, pounds and dollars, is a key variable and leads touncertainties in future cost projections. Where costs have been provided in Euros or dollars,the following exchange rates have been used:GBPEuros equivalentUS Dollars equivalent1.01.11.5
Costs converted from their original currency are marked with an asterisk.Interest ratesInterest rate variability is another key variable. For this study, interest rates will aim to lookat the medium rather than short term picture.9
Potential for Microgeneration: Study and Analysis. Energy Saving Trust, Element Energy, EConnect.2005.
81
Design of Feed-in Tariffs for Great BritainFinal Report
Cost data inclusions/exclusionsThe costs given in this document represent total installed cost for the given technology,including design, plant acquisition, delivery, installation and commissioning, unless otherwisestated.All costs are quoted before VAT.
82
Design of Feed-in Tariffs for Great BritainFinal Report
7.1 PVKey parametersParameterValueComments850 kWh / kWp is typical for well orientated UK PVinstallations.Some PV manufacturers suggest that systems may lastsignificantly longer than this. However, degradation leads toreduced output over time and a 25 year lifetime is taken as aconservative estimate.
Load factor
850 kWh / kWp.yr
Technology lifetime
25 years
Current technology costs2009System size/typeNew build domestic (2.5kWe)Retrofit (2.5kWe)New build (4-10kW)Retrofit (4-10kW)New build (10–100kWe)Retrofit (10–100kWe)New build (100–5,000kWe)Retrofit (100–5,000kWe)Stand alone systemFixed cost (perMarginal cost (£/kW)site)£1,500£3,983£2,000£4,500£4,800 per kW£4,800 per kW£4,300 per kW£4,300 per kW£4,000 per kW£4,000 per kW£4,000 per kWAnnual maintenance cost£110£110£24.00 per kWe£24.00 per kWe£22.00 per kWe£22.00 per kWe£20.00 per kWe£20.00 per kWe£20.00 per kWe
Capital costs for small systems are based on a new build system price c. £5,200 for a 1kWsystem in 2009.10Retrofit costs are slightly higher due to costs of scaffolding and wiring at £6,500 for a1kWp system and £11,000 for a 2kWp system.The fixed costs include mechanical and electrical installation, which are independentof system size and will not be subject to the cost reductions of the PV panels.
10
System costs circa £5,200/kW have been provided by UK installers. This represents a conservativeview and lower costs can be achieved.
83
Design of Feed-in Tariffs for Great BritainFinal Report
For larger systems, the cost of the solar cells makes up a significant portion of theoverall system cost, which means that total cost scales approximately linearly withpower output.Building integrated PV solutions in new build gain an offset benefit of the order £500per kWp (i.e. benefit from the fact that PV tiles replace standard tiles). The net costof building integrated solutions depends on the type of PV system, for examplewhether it is a laminate or double glazed. Feedback from industry suggests that anaverage cost of building integrated PV laminate systems is around £5,500 per kWp,while the figure for double glazed systems is c.£6,000 per kWp.Maintenance costs for the smaller systems are based on a professional electricalcheck and clean every five years taking half a day. An additional £1,000 every 15years is also included in this cost to allow for inverter replacement.11Technology cost projectionsCost projections allow for a significant reduction in cell cost through technical evolution andmaterial supply improvements. During 2007 and 2008, for example, increased availability ofsilicon enabled large reductions to be realised.The PV market is global, and therefore sales to the UK alone are unlikely to significantlyinfluence the future price of PV. It has, however, been noted that some costs for PV (inparticular installation) are likely to decrease as the cumulative UK installed capacity grows.2015System size/typeNew build (<10kWe)Retrofit (<10kWe)New build (4-10kW)Retrofit (4-10kW)New build (10–100kWe)Retrofit (10–100kWe)New build (100–5,000kWe)Retrofit (100–5,000kWe)Stand alone system
Fixed cost (per site) Marginal cost (£/kW)£1,500£2,240£2,000£2,530£2,699 per kW£2,699 per kW£2,420 per kW£2,420 per kW£2,250 per kW£2,250 per kW£2,250 per kW
Annual maintenance cost£110£110£16.00 per kWe£16.00 per kWe£15.00 per kWe£15.00 per kWe£14.00 per kWe£14.00 per kWe£14.00 per kWe
2020System size/typeNew build (<10kWe)Retrofit (<10kWe)New build (4-10kW)Retrofit (4-10kW)New build (10–100kWe)11
Fixed cost (per site) Marginal cost (£/kW)£1,500£1,759£2,000£1,987£2,120 per kW£2,120 per kW£1,900 per kW
Annual maintenance cost£110£110£15.00 per kWe£15.00 per kWe£14.00 per kWe
According to a UK industry source, replacement inverters may be required every 15 years.
84
Design of Feed-in Tariffs for Great BritainFinal Report
Retrofit (10–100kWe)New build (100–5,000kWe)Retrofit (100–5,000kWe)Stand alone system
£1,900 per kW£1,765 per kW£1,765 per kW£1,765 per kW
£14.00 per kWe£13.00 per kWe£13.00 per kWe£13.00 per kWe
7.2 WindKey parametersThe energy output of a wind turbine is highly dependent upon wind speed, which increaseswith increasing height above the ground. Access to masts and towers, where the hub heightcan be increased, therefore greatly improves wind turbine performance.The graph below shows the performance of different installed systems across the UK.Observed values are based on data from a Renewable Energy Foundation report whichanalysed monthly records of load factors (Ofgem data) and have a range of associated hubheights from 25 to 65m.12Observed load factors recorded here are based on an average ofmonthly load factors over a one year period.A comparison between assumed and observed load factorsat varying windspeed for turbines in the 50kW–1.5MW range70%
60%
50%
Observed values - hubheight 40m+Observed values - hubheight <40mTheoretical - 25m hubTheoretical - 40m hub
Load Factor
40%
Theoretical - 60m hub
30%
20%
10%
0%
4
5
6
7
8Windspeed (m/s)
9
10
11
12
12
UK Renewable Energy Data: Issue 1 (08.12.06): Vol. 5: Wind. 1/168, researched by OswaldConsultancy Ltd.
85
Design of Feed-in Tariffs for Great BritainFinal Report
The measured data shows that a large degree of scatter about the theoretical load factors isobserved. The following load factors are proposed for this study.SizeB-M <1.5kW urbanB-M <1.5kW ruralMast mounted micro(urban)Mast mounted micro(rural)1.5–15kW urban1.5–15kW rural15–50kW urban15–50kW rural50–250kW250–500kW500–3000kW5.5 m/s2%8%2%8%7%15%7%15%10%13%15%6 m/s6.5 m/s7 m/s7.5 m/s>8.0 m/s2%2%2%2%2%8%8%8%8%8%2%10%7%15%7%15%15%18%20%2%12%7%19%7%19%19%23%24%2%13%7%23%7%23%23%26%27%2%13%7%23%7%23%23%26%28%2%14%7%26%7%26%26%28%32%
Summary of key parameters:System size/typeMicro (<1.5kW)1.5–15kW15–50kW50–250kW250–500kW500–3,000kWLoad factor8% ruralDependent on windspeedand hub heightDependent on windspeedand hub heightDependent on windspeedand hub heightDependent on windspeedand hub heightDependent on windspeedand hub heightTechnology lifetime10 years15 years15 years20 years20 years20 yearsTypical hub height2m above building10 m15m25m40m60m
Current technology costs2009System size/typeMicro (<1.5kW)1.5–15kW15–50kW
Fixed cost (per site)£3,500£10,000
Marginal cost (£/kW)£2,000£2,000
Annual maintenance cost£110£220£74 per kW
£3,000 total per kW
86
Design of Feed-in Tariffs for Great BritainFinal Report
50–250kW250–500kW500–3,000kW
£3,000 total per kW£2,500 total per kW£1,500 total per kW
£74 per kW£61 per kW£44 per kW
A capital cost of £5,500 is assumed for a retrofit 1kW turbine (building integrated).13Capital costs for tower-mounted micro-wind for a typical installation range from c.£15,000 for a 2.5kW system to £22,000 for a 6kW system. The installation cost is asignificant portion of the total cost at this scale. The capital cost of these installedturbines is relatively insensitive to capacity, and strongly based on electrical andmechanical installation and size-independent hardware.For micro/small wind systems, maintenance cost estimations are based on a bi-annualcheck and service taking half a day. The actual maintenance may vary depending on theturbine quality and location.Capital costs for the small to large scale turbines are based on an installed cost of£46,000 for a 15kW turbine, £150,000 for a 50kW turbine, £250,000 for a 100kWturbine and £1,470,000 for a 1MW turbine (2009) based on discussions with several UKsuppliers and BWEA. Costs include civil works for an average site.For reference, an Ernst & Young report for the DTI in 2007 quoted a capex of £1,089/kW, andan opex of £41/kW for large scale turbines.14Technology cost projectionsThe fixed and marginal costs reduce over time to allow for improvements to mounting andinstallation, and the development of wind turbine specific power electronics.Costs are expected to decline as the installed base grows and supply chains mature and aswind turbine specific power electronics are developed further.15Supply chains areparticularly limited for new turbines in the 50–500kW bracket.Future costs are given in 2008 prices.2015System size/typeBuilding mounted(<1.5kW)1.5–15kW15–50kW50–250kW13
Fixed cost (per site)£2,116£10,000
Marginal cost (£/kW)£1,209£1,209
AnnualMaintenance£110£220£61 per kW£61 per kW
£2,444£2,444
Capital costs are based on the following manufacturers: Ampair, Eclectic Energy, Marlec, RenewableDevices and Zephyr.14http://www.berr.gov.uk/files/file39038.pdf15Potential costs reductions are more limited for small systems due to high costs of civil works and theplanning process, which are not expected to change significantly over time.
87
Design of Feed-in Tariffs for Great BritainFinal Report
250–500kW500–3,000kW
£2,037£1,278
£60 per kW£38 per kW
2020System size/typeBuilding mounted(<1.5kW)1.5–15kW15–50kW50–250kW250–500kW500–3,000kW
Fixed cost (per site)£1,932£10,000
Marginal cost (£/kW)£1,137£1,137£2,200£2,200£1,833£1,139
Annual maintenance cost£110£220£55 per kW£55 per kW£46 per kW£34 per kW
88
Design of Feed-in Tariffs for Great BritainFinal Report
7.3 Hydro powerKey parametersFor electricity generation from a hydro source to be feasible, it is necessary to harness theenergy from the movement of a significant amount of water. Typically a suitable stream,river, or weir is therefore required. At small scales (<10kW) a low head (<10m) system isassumed, whereas at the 10–50kW scale a medium head (10–50m) system is costed.System size1–10 kW10–50kW50–100kW100–500kW500kW–5MWTurbine efficiency85%85%85%85%85%Load factor30%30%30%30%30%System efficiency(water to wire)70%70%70%70%70%
Current technology costs2009System size1–10 kW10–50kW50–100kW100–500kW500-1,000kW1,000kW–5MW
Fixed cost (per site)Marginal cost (£/kW)£8,000£4,200£10,000£3,000£3,200 per kW£3,000 per kW£2,750 per kW£2,250 per kW
Annual maintenance cost£440£440£12,500£20,000£50,000£50,000
For small systems, capital costs are highly site-specific, and vary from £3,000 to£10,000 per kW.16A low head system could cost from c. £4,000 per kilowatt up to 10kW.17Costs for a medium head system are around £10,000 fixed with an additional £2,500per kilowatt up to 10kW.18Although some reduction in turbine costs is expected due to increases in productionvolumes, civil works and the planning process dominate the total installation costand these are not expected to change significantly in the future.On small systems (<50kW), maintenance costs are based on an annualinspection/service taking one day. Routine maintenance such as screen cleaning isnormally carried out by the owner. On larger systems, we have assumed an annualmaintenance charge based on a service contract.1617
Based on discussions with mill owners in the South West of England.http://www.cus.net/renewableenergy/subcats/hydroelectric/hydroelectric.html18http://www.cus.net/renewableenergy/subcats/hydroelectric/hydroelectric.html
89
Design of Feed-in Tariffs for Great BritainFinal Report
Capital costs for hydro projects comprise three main components: about 10% is fordesign studies and administrative costs, 55–60% for civil engineering and 30–35% forhydromechanical and electrical equipment.
Technology cost projections2015 & 2020System size1–10 kW10–50kW50–100kW100–500kW500-1,000kW1,000kW–5MW
Fixed cost (per site)Marginal cost (£/kW)£8,000£4,200£10,000£3,000£3,200 per kW£3,000 per kW£2,750 per kW£2,250 per kW
Annual maintenance cost£440£440£12,500£20,000£50,000£50,000
90
Design of Feed-in Tariffs for Great BritainFinal Report
7.4 Wave powerKey parametersWaves incident on the UK’s Atlantic coastline have a power density of around 40kW permetre of shoreline.19The UK benefits from an exposed Atlantic coastline of the order of1,000km, which implies a technical resource of over 40GW. Although the number ofcommercially available wave energy converters is currently small, much research anddevelopment is on-going in this area. The approach employed to estimate the sub-5MWwave resource is described in Appendix B. The resource was divided into 4 bands of differentaverage wave powers, from 7.5kW/m to 30kW/m.Technology parameters
Resource bandWells turbine(7.5kW/m)Wells turbine(15kW/m)Wells turbine(22.5kW/m)Wells turbine(30kW/m)
Capex in2009 (£/kW)£7,824
Capex in2015 (£/kW)£7,000
Capex in2020 (£/kW)£6,500
Fixed Opex(£/kW)£63
Loadfactor (%)13%
£7,824
£7,000
£6,500
£63
26%
£7,824
£7,000
£6,500
£63
39%
£7,824
£7,000
£6,500
£63
52%
Commercial wave power is a nascent market. The world’s first commercial wave farm wasofficially opened in September 2008 and many wave energy generators are currently at thedemonstration and development phase. The costs above are based on industry data from asmall number of stakeholders.Technology cost projectionsDue to the relative immaturity of this market, significant cost reductions are anticipated. Forexample, experience gained through demonstration projects will allow efficiency
19
http://www.ma.hw.ac.uk/~denis/wave.htmlftp://ftp.ma.hw.ac.uk/pub/denis/waveuk.pdf
91
Design of Feed-in Tariffs for Great BritainFinal Report
improvements through design modifications. Also, further research and development couldlead to lower manufacturing and assembly costs for example.
92
Design of Feed-in Tariffs for Great BritainFinal Report
7.5 Tidal powerKey parametersThe UK benefits from one of the largest tidal resources in the world. The total incoming tidalpower incident on the UK from the Atlantic Ocean has been estimated at 250GW.20Like wavepower machines, tidal generators are at an early stage of commercialisation, with severaltechnology demonstration projects currently on-going. There are a number of alternativemethods of capturing energy from tides, including tidal stream generators (operating on thesame principles as wind turbines, only under water), tidal barrages, tidal lagoons, tidalfences, and tidal reefs. Tidal barrages are a proven technology, for example the barrage at LaRance in France has produced 60MW of power on average since 1966. However, suchtechnology is not relevant for this study as any barrage is likely to far exceed the 5MWefeed-in tariff cap. Tidal lagoons, which are created by building walls in the sea (effectively creatingan artificial estuary), also benefit from advantages of scale and so are also unlikely to berelevant to this study. The most likely pertinent technology for this work is the tidal streamgenerator. A number of these devices are currently under development in the UK, andcurrent designs are for turbines with a power output of around 1MW.Current technology costs2009TechnicalCapex(£/kW)2,170
CivilsCapex(£/kW)790
ConnectionCapex(£/kW)790
TotalCapex(£/kW)3,750
Fixed Opex(£/kW)100
VariableOpex(£/kWh)0
Several tidal stream demonstration projects are currently underway and thecommercialisation of this technology remains at an early stage. Certainty over current andfuture costs will increase as the first commercial-scale projects are deployed.
20
Cartwright, D. E., Edden, A. C., Spencer, R., and Vassie, J. M. (1980).The tides of thenortheast Atlantic Ocean.Philos. Trans. R. Soc. Lond. Ser. A, 298(1436):87–139.93
Design of Feed-in Tariffs for Great BritainFinal Report
7.6 Biomass CHPKey parametersA range of different technologies involving biomass feedstocks currently exists, and eachtechnology has an associated capacity range in terms of power output. Sizes selectedrepresent assumptions on current suitable ranges for the technologies listed. Sometechnologies perform better in CHP applications than others, and if electricity generation isthe sole purpose, efficiencies can be improved by designing and running the technology forproduction of electricity only. In the table below, the overall efficiency is defined as the netuseful energy output (including heat for a CHP plant) as a percentage of the energy contentof the fuel (LHV).Plant size (kWe)100kWe–500kWe CHP500kWe–3MWCHP3–5MWe CHP3–5MWeTechnologyHeat turbineOrganic RankineCycleSteam turbineCHPSteam turbine(electricity only)Heat to powerratio3.8:14.3:12.7:1N/AElectricalefficiency17%16%23%27%Overall Efficiency82%85%85%27%
Current technology costs2009Plant size (kWe)100kWe–500kWe CHP500kWe–3MW CHP3–5MWe CHP3–5MWeElectricity only
Marginal cost (£/kWe)£4,700 per kWe£5,800 per kWe£2,500 per kWe£2,500 per kWe
Annual maintenance cost5.0% of capex2.5 % of capex3.9% of capex3.9% of capex
Fixed costs do not include heat distribution costs.Costs for the 100kWe–500kWe are based on a Talbotts 100kWe system.Costs for the 3–5MW biomass steam turbine are based on a recent quote for a 3.5MWsystem of c. £7 million. Maintenance costs are based on £13 per MWh and run hours of6,000 hours per annum.Costs for the ORC system are based on €6.43 million for a 1MW system. Other quotesinclude €4.5 million for a 500kW system and €8.15 million for a 1.5MW system.
94
Design of Feed-in Tariffs for Great BritainFinal Report
Costs have been cross checked against Pöyry internal numbers and Ernst and Young(2007) projections.
Technology cost projections2015Plant size (kWe)100kWe–500kWe CHP500kWe–3MW CHP3–5MWe CHP3–5MWeElectricity only
Marginal cost (£/kWe)£3,360 per kW£4,872 per kW£2,625 per kW£2,625 per kW
Annual maintenance cost5.0% of capex2.5 % of capex3.9% of capex3.9% of capex
2020Plant size (kWe)100kWe–500kWe CHP500kWe–3MW CHP3–5MWe CHP3–5MWeElectricity only
Marginal cost (£/kWe)£2,960£4,292£2,450£2,450
Annual maintenance cost5.0% of capex2.5 % of capex3.9% of capex3.9% of capex
95
Design of Feed-in Tariffs for Great BritainFinal Report
7.7 Gas CHPKey parametersParameterDomesticCommercial
Technology type
Stirling Engine
Fuel Cell
Gas Engine
Indicative sizeHeat:power ratioElectrical efficiency(%)System efficiency (%)
1kWe6:1
1kWe1:1
5–50kW2:1
12%
43%
35%
85%
85%
85%
Current technology costs2009System size/typeDomestic (Stirling engine)Domestic (fuel cell)Commercial (gas engine)
Fixed cost (per site)£2,000£2,000
Marginal cost (£/kWe)£1,500£6,000
Annual maintenance cost£110£110£100 per kWe
£1,500 total per kWe
Fuel cell micro CHP capital costs are based on discussions with a UK manufacturer. Theseare projections as units are not currently available.Stirling engine micro CHP costs are based on current prices for a 1kWe system.Maintenance costs for domestic systems assume 0.25 days per year professionalservice/maintenance in line with current boiler requirements. Maintenance requirementsare currently much higher due to technology immaturity and for the systems to succeedin the market a reduction to boiler levels will be necessary.Larger CHP capital costs can vary depending on installation requirements. The costs usedhere are based on an in installed cost of £25,000 for a 13kWe system and £75,000 for a50kWe system.Reciprocating CHP technology has a relatively large installed capacity and the technologyis mature. For this reason, the projections assume negligible cost reduction.
96
Design of Feed-in Tariffs for Great BritainFinal Report
Maintenance costs assume an annual service contract costing £1,350 for a 13kWe gasengine and £7,000 for a 50kWe system. These costs include an annual service, parts,labour and an engine rebuild/replacement every five years.CHP operation hours need to be high for feasible systems. The use of 5,000 hours per yearreflects a system which is used throughout the year for space hearing and hot water andmakes use of thermal storage.Technology cost projectionsNeither Stirling engines nor fuel cells are currently available in commercial quantities. Stirlingengines are expected to become available through energy suppliers in 2009, and fuel cellsshould follow in one or two years. As such, cost reductions are expected to occur asproduction volumes increase and supply chains mature. Gas engine CHP is already widelyused globally and is based on mature technology; costs are therefore assumed to remainstatic in the future.2015System size/typeDomestic (Stirling engine)Domestic (fuel cell)Commercial (gas engine)2020System size/typeDomestic (Stirling engine)Domestic (fuel cell)Commercial (gas engine)
Fixed cost (per site)£2,000£2,000
Marginal cost (£/kWe)£1,296£2,753
Annual maintenance cost£110£110£100 per kWe
£1,500 total per kWe
Fixed cost (per site)£2,000£2,000
Marginal cost (£/kWe)£1,156£1,881
Annual maintenance cost£110£110£100 per kWe
£1,500 total per kWe
97
Design of Feed-in Tariffs for Great BritainFinal Report
8 Appendix B – Estimation of the potential for sub-5MWrenewable electricity.8.1.1Photovoltaics
Commercial systemsThe potential resource for building-integrated and building-attached PV in Great-Britain isconstrained by available roof area. The suitable roof-space on buildings in the non-domesticsector was estimated using floor space data from the Valuation Agency Office. The floorspace data were converted to suitable roof areas using factors determined by the IEA study,Potential for Building Integrated Photovoltaics(2002).21These factors attempt to take intoaccount the percentage of architecturally unsuitable roof space and roof area withinsufficient solar yield due to orientation. A space utilisation factor is also applied to allow foraccess on the roof around the PV array and for installation of safety systems. Calculationsassume typically 70% of the available roof area may be covered with PV panels. Table 33shows the factors used to convert floor areas to suitable roof areas for non-domesticbuildings.Table 33 Factors used to convert building floor area to suitable PV roof area (from IEA 2002)
Conversion factorRatio of roof area to floor areaSuitable architectural building envelopeRoof area with sufficient insolationSpace utilisation factorOverall conversion factor
Value1.20.60.550.70.28
Total commercial and industrial floor space was estimated at ward level and each ward wasallocated to one of four insolation bands, as shown in Figure 27. The overall potential wasthen broken down into a number of discrete system sizes using data on the size distributionof commercial premises from the VOA, shown in Table 34. The maximum system sizepermitted on premises with floor areas of less than 30m2is 1kW, which is substantiallysmaller than the majority of commercial installations. For this reason, these premises wereexcluded from the analysis. Table 34 also shows that 93% of premises have floor spaces lessthan 1000m2, equivalent to a maximum PV system size of 35kWe.21
http://www.iea-pvps.org/products/rep7_04.htm
98
Design of Feed-in Tariffs for Great BritainFinal Report
In addition to commercial roof-based systems, there is also significant potential for stand-alone systems on agricultural land. The total resource is dependent on the amount ofavailable land and the economic attractiveness of PV compared with alternative land uses.There are additional constraints due to the ability of the electricity grid to absorb largeamounts of renewable energy in rural areas where land availability is highest. We haveassumed that the absolute potential for stand-alone installations is 0.05% of agriculturalland. The total agricultural land area in the UK is 15 million hectares22, so the stand-alone PVresource is approximately 9GW, or 8TWh of electricity per year.
Solar insolation(kWh per m2per year)85095010501150501250
Figure 27 Insolation map of the UK
Table 34 PV system sizes for different floor space bands
Premises floor area (m2)Less than 3031-100101-30022
% of premises10%37%31%
PV area(m2)82884
Max PV arraysize (kW)13.511
Data from UK Land Directory : http://www.uklanddirectory.org.uk/land-use-statistics.asp
99
Design of Feed-in Tariffs for Great BritainFinal Report
301-10001001-30003001-10000
16%5%1%
2808402,800
35105350
Domestic ResourceIn the domestic sector, it will be assumed that 50% of households (excluding flats,maisonettes and apartments) have potential to install PV. This is to account for some lack ofideal orientation and lack of architectural suitability of certain properties (e.g. listedbuildings). All domestic properties are assumed to install 2.5kWesystems, requiring a roofarea of 20m2. The annual new build rate is assumed to be 1% of the existing stock, andsystems can be installed at significantly lower cost on these buildings. After one year, newbuild properties without PV are added to the existing building potential since the benefit oflower installation costs only applies during construction.The total PV resource in Great Britain is shown in Table 35. The total resource is 60 TWh peryear, with over one-third of this potential found in the domestic retrofit sector. Of thecommercial-resource, 5.5TWh are in small, 4-10kW systems, while 8.5TWh is from stand-alone systems on agricultural land.Table 35 Total PV resource in the domestic and commercial sectors
TypeTechnical resource (TWh per year in 2010)New build domestic (2.5kW)0.18Retrofit domestic (2.5kW)22.1New build 4-10kW0.04Retrofit 4-10kW5.5New build 10–100kW0.11Retrofit 10–100kW11.0New build 100–5000kW0.13Retrofit 100–5000kW12.8Stand alone system8.5Total60.48.1.2Wind
Estimation of resource potentialMicro-wind
100
Design of Feed-in Tariffs for Great BritainFinal Report
Micro-wind turbines tend to be linked to buildings, either because they are physicallyattached or linked to the building’s electrical system in the case of mast-mounted microturbines. Therefore, the potential resource for these machines depends on the number ofsuitable buildings. The potential for micro-wind is a trade-off between the number ofbuildings and expected load factors. While the turbines themselves can be installed on alarge number of buildings, recent field trial results suggest that the majority of urban sitesmay have very low load factors due to low mean wind speeds and turbulence caused bysurrounding buildings. Therefore, it was assumed that micro-wind is not suitable for urbanareas. This is consistent with analysis by the Carbon Trust, which concluded that there wasalmost no urban wind resource available at a generating cost of less than £100/MWh, andthe urban sites comprised only 10% of the total resource available at £1000/MWh23. In wardsthat meet the criteria for wind speed and rurality, it is assumed that one micro-wind turbinecan be installed on each house. For homes in the most rural wards, it is assumed thatconsumers install mast-mounted turbines in gardens rather than building-mountedmachines. Turbines are not permitted on flats. Table 36 shows the potential for micro-windturbines in Great Britain. The total potential is approximately 3.5 million machines, with twothirds of this resource occurring below 6m/s.Table 36 Potential for micro-wind turbines in Great Britain
Windspeed(m/s)5.5–6.06.0–6.56.5–7.07.0–7.57.5–8.0>8.0TOTAL
No. of building-mounted microturbines2,102,576579,815208,65787,44231,99413,2123,052,251
No. of mast-mounted microturbines155,328116,24966,25128,49320,60614,646394,398
The potential for sub-5MW wind in Great Britain is assumed to be constrained by wind-speedand the availability of local grid capacity. Assessment of wind potential was based on theNOABL wind speed database, combined with energy consumption and greenspace data foreach ward in England. Since data at ward level were not available between Scotland andWales, representative English regions were used as a proxy. Analysis conducted by ElementEnergy (2008)24suggested that sub-5MW turbines are unlikely to be economic at wind-23
Carbon Trust (2008): Small-scale Wind Energy: Policy insights and practical guidance
24
Element Energy (2008) - The growth potential for on-site Renewable electricity generationin the non-domestic sector in England, Scotland and Wales
101
Design of Feed-in Tariffs for Great BritainFinal Report
speeds of less than 5.5ms-1, even with high levels of support from a Feed in Tariff, and wardswith wind speeds below this value were excluded from the analysis. Figure 28 shows theannual mean wind speeds for each ward in England and Wales.Figure 28 Annual mean wind speeds in English and Welsh Wards (m/s). Areas of Outstanding Natural Beautyare shaded in blue.
For a given ward, the total wind potential was then constrained by the strength of the localelectricity grid. A national map of grid capacity limitations on the 11kV distribution grid is notpublically available, so the total electricity demand in the ward was used as a proxy. Thecorresponding base load power demand was multiplied by 2.5 to give the peak power thatcan be accepted by the local grid.
102
Design of Feed-in Tariffs for Great BritainFinal Report
Once the grid constraints had been established for each ward, the amount of green spacewas used to determine the maximum turbine size that could be installed. Due to the lack ofgreen space in dense urban areas, wards with this classification were excluded at this stage.Table 37 Maximum turbine size for different greenspace bands
Greenspace fraction within ward<30%30-50%50-70%70-80%>80%
Indicative turbine size (kW)6301503751500
Table 38 shows the total potential for sub-5MW wind in Great Britain. The total resource isover 17TWh, with large megawatt-class turbines contributing over half of this total. This isequivalent to over 4% of UK electricity demand.Table 38 Total sub-5MW wind resource in Great Britain
Turbine size Total resource (TWh per year)Micro1.5-15kW15-50kW50-250kW250-500kW500-3000kWTotal
3.791.061.351.451.648.3917.69
103
Design of Feed-in Tariffs for Great BritainFinal Report
8.1.3
Hydro power
Several studies have attempted to quantify the hydropower resource in the UK. The mostdetailed was carried out by the Energy Technology Support Unit (ETSU) in 1989 for theDepartment of Energy. The study estimated the UK hydropower resource to be 320MW.However, the analysis was based on the number of schemes that were financially viable atthe economic conditions and policy support at the time. This meant that low head sites, andany sites with potential power outputs below 25kW, or 50kW in rural areas, were excludedfrom the analysis. Turbine technology has advanced since 1989, and a Feed-in Tariff is likelyto significantly improve economics of hydropower installations and will allow a largerpotential to be harnessed. The Scottish Hydropower Resource report estimated a potential of620 MW from sub-5MW installations. A recent report by IT Power suggested that the smalland medium-scale hydro resource in England and Wales is approximately 250MW. Includingthe Northern Ireland resource, the total hydro resource in the UK is approximately 1GW.The reports cited above do not contain a breakdown of the resource by turbine size. Work bythe Joule Centre estimated that there are 10,000 sites with power outputs below 5kW and afurther 1,000 sites with outputs between 5kW and 100kW25. We have assumed the followingresource potential for each turbine size:Table 39 UK hydro power resource by system size
TotalresourceSystem size range Potential no. of UK installations Potential capacity (MW)(MWh/yr)1–10kW10,000500.2210–50kW500150.0750–100kW50037.50.16100–500kW1,0003001.31500–1,000kW5003751.641,000–5,000kW1003001.31Total12,6001,0784.72
25
Joule Centre research cited in http://www.imsplc.com/articles/HYDRO%20POWER%20ARTICLE.pdf
104
Design of Feed-in Tariffs for Great BritainFinal Report
8.1.4
Wave power
Estimation of resource potentialIn terms of potential for the UK, the maximum available energy from wave power dependson the number of wave energy converters deployed and their efficiencies in converting theraw resource of c.40GW (see above) into electricity. According to the manufacturer, thePelamis wave energy converter (currently deployed in the Atlantic off the coast of NorthernPortugal) produces around 5.3kWpper metre of machine and has a load factor in the regionof 25–40%. Taking a relatively conservative figure of 30% load factor, with 5.3kWpper metre,this implies that the absolute maximum energy available would be of the order 14TWh peryear if all 1,000km of available coastline were exploited. Given the high cost of connectingmarine renewable energy systems to the land-based electricity grid, it is likely that themajority of these devices will be installed in clusters with a total capacity greater than the5MW limit for the Feed-in Tariff. For example, the three Pelamis devices currently operatingof the Portuguese coast have a peak output of 2.25MW, but a further 28 machines will beadded to take the overall peak capacity to 22.5MW26. For this reason, it was assumed that allsub-5MW installations will be based on existing breakwaters near to shore. The potential forthese near-shore systems was based on an analysis of the Atlas of UK Marine EnergyResources. Only sites with water depths less than 25m and a distance of 5km from the shorewere included. The resource was further constrained by allowing only sites that were close toa centre of population, used as a proxy for electricity grid capacity. For each of suitable sites,the atlas provided the mean annual wave power (in kW/m), which was used to estimate theannual energy yield from each project.Table 40 shows the estimated potential for sub-5MW wave power in the UK. The analysisshows that there are only 26 sites suitable for small wave projects. The total resourceassumes a water to wire efficiency of 50% and a system availability of 85%. The total capacityassumes a peak power rating of 4MWeper site.Table 40 Potential for sub-5MW wave power in the UK
Mean annual wave power No. of suitable(kW/m)sites in UK7.51525Total
Total resource (GWhper year)11510267770233379
Total capacity(MW)442040104
26
Based on discussions with the manufacturer. Seehttp://www.pelamiswave.com/content.php?id=149
105
Design of Feed-in Tariffs for Great BritainFinal Report
8.1.5
Tidal power
Estimation of resource potentialThe world’s first commercial tidal stream generator is located in Strangford Lough inNorthern Ireland and has an output of up to 1.2MW. Other commercial projects are plannedfor the UK, for example off the coast of Anglesey and Pembrokeshire in Wales. Like wavepower, it is expected that the costs involved in offshore construction, maintenance and gridconnection will strongly favour clusters of turbines with total power outputs well above5MWe. We have assumed that sub-5MW projects are sized at 5MW and sited close to theshore. Black and Veatch (2008)27conducted a detailed review of the UK’s tidal streamresource. The total UK resource was estimated to be 118TWh, with 18TWh of this technicallyextractable. However, 70% of the resource is in water depths greater than 30m, and thereare only 18 identified sites in depths below 25m. These 18 sites are assumed to form the sub-5MW in this study. Table 41 shows the estimated sub-5MW tidal resource in the UK. Thetotal resource is 0.2TWh, equivalent to 0.05% of UK electricity consumption.Table 41 Estimated sub-5MW tidal resource in the UK
Mean spring tidepeak velocity (m/s)<2.52.5–3.5>3.5
Installedcapacity at eachsite5MWe5MWe5MWe
No. of UK sites withdepth less than 25m
Loadfactor420%1125%330%Total
Totalresource(GWh/yr)3512039194
27
Black and Veatch (2005) –Tidal Stream Resource and Technology Summary Reporthttp://www.carbontrust.co.uk/NR/rdonlyres/19E09EBC-5A44-4032-80BB-C6AFDAD4DC73/0/TidalStreamResourceandTechnologySummaryReport.pdf
106
Design of Feed-in Tariffs for Great BritainFinal Report
8.1.6
Biomass
8.1.6.1 Potential for biomass CHP in district heating networksIn the majority of Feed-in Tariff scenarios described in the Analysis section, it is assumed thatall sub-MW biomass plants will be operated in CHP mode. This is because electricity onlyplants at the sub-5MW scale have low electrical efficiencies compared to conventionalthermal plant (25% compared with 40%+), and so if biomass is to be used in electricity-onlyplants, it should be co-fired in gigawatt scale sites rather than burned in small, decentralisedsystems.For CHP plants, the overall resource for electricity generation is constrained by theavailability of heat loads. The heat loads are divided into those supplied through a districtheating network, or on-site loads in commercial or industrial premises.Several recent studies have quantified the potential for district heating in the UK. Likeestimates of the hydro power resource, they are based on the number of schemes that arefinancially viable at current technology and fuel prices. A recent study for Defra28conductedan analysis based on heat densities (expressed in MW per km2) for domestic and commercialpremises in different post-codes throughout the UK. The rates of return for CHP plantsconstructed to supply these loads were then calculated, and the total resource at three ratesof return was estimated. The total resource was found to be extremely sensitive to the rateof return chosen, with a resource of 150TWh heat per year at 6% decreasing to 0.6TWh at acommercial rate of 9%.A more recent study by Faber Maunsell also found the potential for district heating to varywidely depending on assumptions on discount rates and policy support. The medianpotential in the Faber Maunsell study is 18.3TWh of heat per year, which assumes a 6%discount rate and a reduction in the capital costs of the CHP plants of 20%. Since this closelyreflects the technology cost projections in this model, we have based the potential for districtheating on this scenario. Given the large heat loads in some dense urban areas, these areasmay be served by plants larger than 5MWe. It is assumed that if a sufficiently generous Feed-in Tariff is offered to sub-5MW plants, these smaller plants will be deployed in preference tolarger plants since they offer better rates of return.For CHP plants supplying heat through a district heating system, the cost of consumerconnections significantly increases the levelised cost of energy. Whether the heat network isfinanced by the plant operators or a third party, the costs are borne by the heat supplier28
Defra (2007) http://www.defra.gov.uk/environment/climatechange/uk/energy/chp/pdf/potential-report.pdf
107
Design of Feed-in Tariffs for Great BritainFinal Report
since it reduces the price it can charge for heat supplied to end users. Connection costs varysubstantially with the housing density area in a given area. The Town and Country PlanningAssociation estimates connection costs per dwelling to vary from £2,500 for a high riseapartment to £9,550 for a detached house29. Table 42 shows the connection costs for thethree dwelling types used in the model. The connection costs differ from those in the TCPAstudy because the dwelling categories differ slightly from those in this model. Heat demandsper dwelling are based on an analysis carried out by Element Energy for the Energy SavingTrust on the potential for community-scale renewable energy30. When adjusted for the heatdemands of individual dwellings, the connection cost per kWh varies from 1.1p/kWh forurban flats to 2p/kWh for detached houses. This in addition to the price paid by end users forthe heat supplied through the network.Table 42 District heating network connection costs
Technology100kW heatturbine
Dwelling typeUrban flatsTerraced housesDetached/semi-detached housesUrban flatsTerraced housesDetached/semi-detached housesUrban flatsTerraced housesDetached/semi-detached houses
HeatdemandperConnectio dwellingn cost(kWh)£3,133£5,300£8,625£3,133£5,300£8,625£3,133£5,300£8,62514,39115,51021,62214,39115,51021,62214,39115,51021,622
Numberofdwellings served10497691,3901,2909253,1272,9012,081
Connection chargeper kWhheatdelivered(p/kWh)1.11.72.01.11.72.01.11.72.0
Organic RankineCycle
Steam turbine
The connection cost per dwelling is significantly lower in new dwellings than in retrofitinstallations. This is because developers avoid the need to install conventional boilers in thehomes. In addition, the cost saved in not connecting the property to the gas grid offsetssome of the cost of the heat pipes. We have assumed that the total value of the savings innew build properties is £2,000 per dwelling. However, the lower connection costs are partly2930
TCPA (2008) : Community Energy - Urban Planning for a Low Carbon FutureEST (2008): Power in Numbers – The Benefits and Potential of Distributed Energy Generation at theSmall Community Scale.
108
Design of Feed-in Tariffs for Great BritainFinal Report
offset by the lower heat demands of new buildings due to improved energy efficiency. Whenexpressed per kWh of delivered heat, the connection cost for detached and semi-detacheddwellings is 50% higher in new build versus retrofit properties. Costs for urban flats are lowerbecause the boiler cost saving comprises a higher proportion of the total connection cost.Table 43 Connection costs for new dwellings
Technology100kW heatturbine
Dwelling typeHigh-rise apartmentTerraced housesDetached/semi-detached housesHigh-rise apartmentTerraced housesDetached/semi-detached housesHigh-rise apartmentTerraced housesDetached/semi-detached houses
HeatdemandConnectio pern costdwelling£1,133£3,300£6,625£1,133£3,300£6,625£1,133£3,300£6,62510,00010,00010,00010,00010,00010,00010,00010,00010,000
Numberofdwellings served1501501502,0002,0002,0004,5004,5004,500
Connection chargeper kWhheatdelivered(p/kWh)0.61.73.30.61.73.30.61.73.3
Organic RankineCycle
Steam turbine
8.1.6.2 CHP Potential in Individual BuildingsThe potential for biomass CHP in individual commercial premises is based on Defra (2007)28.This analysis was based on the BRE’s non-domestic energy model, which was used toestimated total heat loads and load profiles of a range of commercial building types andsizes. These load profiles were then interacted with the heat and power characteristics of themost suitable CHP technology, to estimate the rate of return for each building type. Thestudy identifies a total heat load in buildings suitable for CHP of 12TWh per year, which isrelatively insensitive to the discount rate chosen. It should be noted that the analysis in Defra(2007) was based on gas-fired CHP. We have assumed that due to additional constraints onair quality in dense urban areas and space limitations, only 50% of the 12TWh potential isavailable to biomass technologies.Assessing the potential for CHP in industrial premises is more challenging, given subset ofCHP technologies investigated in the model. Many industrial heat loads are at higher109
Design of Feed-in Tariffs for Great BritainFinal Report
temperature than can be supplied by heat turbines or organic rankine cycle systems, andloads in many premises are substantially higher than can be supplied by sub-5MWeplants.Work being carried out on the Renewable Heat Incentive by NERA and AEAT identifies anindustrial biomass heating potential of 18.75TWhthin 2,000 sites. Since biomass CHP systemsare subject to similar air quality and space constraints as heat only biomass, we haveassumed that all of this potential is available for biomass CHP given sufficient Feed-in Tariffsupport.Table 44 Total biomass CHP resource in all sectors
TypeDistrict heating - new buildDistrict heating - retrofitStand-alone commercialLow temperature industrialTotal
Annual Resource (TWh)1.517618.7543.25
110
Design of Feed-in Tariffs for Great BritainFinal Report
8.1.7
Waste
The resource for electricity generation from waste is constrained by the amount of suitablewaste. Incineration and advanced thermal treatment plants are more versatile can treat anycarbon rich waste, including plastics, and hence is more versatile than AD which can onlytreat biological waste. In addition, other non-electricity technologies such as mechanicalbiological treatment (MBT), recycling, and composting compete for waste that is not sent tolandfill.Table 41 shows the estimated sub-5MW waste resource in the UK. It is assumed that the only5% of suitable carbon-rich feedstocks are available to sub-5MW incineration and ATT plants,with the remainder being used in larger plants or recycled. Of the 5% of the overall wasteresource available to sub-5MW thermal plants, 50% each is allocated to ATT and incinerationsystems. The entire food-waste resource is available to AD plants if the financial returns aresufficiently good. In other words, if a generous feed-in tariff were offered to AD plants, food-waste would be diverted from other treatment technologies. The total sub-5MW resource isassumed to be over 4.5TWh, or 1% of UK electricity consumption. Over 3TWh of thisresource is in AD plants.Table 45 Estimated sub-5MW waste resource
TechnologyAdvancedThermalTreatmentAnaerobicDigestionIncineration
Energy densityof waste(kWh/t)
Annual resourceavailable(tonnes)31
Overallelectricalefficiency
Annual electricitygeneration (TWh)
4,4692,2224,469
637,68212,447,259637,682Total
26%12%18%
0.743.320.514.57
31
From Defra waste statistics
111
Design of Feed-in Tariffs for Great BritainFinal Report
8.1.8 Gas CHPThe potential for small and medium scale CHP is constrained by the availability of sites withsufficient heat demand to ensure sufficient run hours for the system. In the domestic market,there are approximately 20 million homes with a gas connection, so the technical capacity fordomestic CHP is over 20GWe. Since these devices compete in similar sites, it is not possibleto allocate the resource to the individual technologies. The uptake of Stirling engine and fuelcell will be determined by their economic performance relative to the incumbent (gasboilers), each other, and other low carbon technologies such as heat pumps or biomassboilers. However, due to the low heat demands of modern homes, Stirling engines arefundamentally ill-suited to new build properties. The lower heat to power ratio of fuel cellmicro CHP units makes this technology better suited to the domestic market, potentiallyincluding new build properties. However, this technology is still at the demonstration phaseand domestic fuel cell CHP units are not currently commercially available.The UK CHP resource was divided into high and low run hours installations in bothcommercial and domestic buildings. Since CHP systems with peak power outputs above50kWeare not eligible for support under the Feed-in Tariff, buildings whose heat demandscould not be met by systems of this size were excluded from the analysis. It was assumedthat commercial buildings could install a gas-engine CHP system rated at 10kWeor 50kWe.Domestic buildings could install Stirling engines or fuel cell, both rated at 1kWe. Whenoperated in heat-led mode with no heat rejection, system run hours and hence electricitygeneration is highly site-specific. Table 46 shows the full load run hours for the range of CHPsystems and site types. Due to the high heat to power ratio of Stirling engine systems,electricity production in new build properties is much lower than from an equivalent fuel cell.Gas-engine systems in high run hours premises, such as hotels and small leisure centres withpools, are assumed to run for 6,000 hours per year, with systems in less optimal sites runningfor 3,000 hours.The number of potential installations in domestic buildings is based on housing data fromDCLG and the English Housing Condition Survey data. High run hours buildings were definedas homes constructed before 1980, due to lower thermal efficiencies, and low-run hoursbuildings were those built after 1980. The potential in commercial buildings is based on dataon commercial floorspace from the Valuation Office Agency. These data relate to ‘bulk class’premises, defined as offices, retail, warehouses and factories, and are assumed to have lowoccupancy hours and hence low CHP run hours. Previous Element Energy analysis identifiedan additional 60,000 ‘non-bulk’ premises, such as hospitals, residential homes, and leisurecentres with high potential CHP run hours. The CHP potential in new buildings is based on240,000 new homes constructed each year, with 80% suitable for gas-fired CHP, and a 1%increase in the number of commercial buildings each year.
112
Design of Feed-in Tariffs for Great BritainFinal Report
The total estimated CHP resource in the UK is 112 TWh of electricity per year, equivalent toover 25% of UK electricity consumption. Over 75% of this resource is in the domestic retrofitsector, with high run hours sites in commercial premises providing an additional 5TWh.It is assumed that CHP systems will be installed as boiler replacements in homes or plantrooms of commercial buildings. Therefore, the maximum deployment in a given year is equalto the number of annual boiler sales in the UK, which were 1.56 million units in the domesticsector and 70,000 units in commercial buildings32.Table 46 Sub-50kW CHP potential in the UK
Site typeNew build
TechnologyDomestic StirlingDomestic Fuel Cell10kW gas engine50kW gas engineDomestic StirlingDomestic Fuel Cell10kW gas engine50kW gas engineDomestic StirlingDomestic Fuel Cell10kW gas engine50kW gas engine-
Full loadNumber ofTotal potentialrun hours sites(TWheper year)60096,0000.1300096,0000.345004,5000.245005000.130005000600060002000400030003000-9,880,0009,880,00054,0006,0001,560,0001,560,000396,00044,00023,577,00029.649.43.21.83.16.211.96.6112.6
Retrofit - high runhours
Retrofit - low runhours
Total
32
Data from the Heating and Hot Water Industry Council
113