Miljø- og Planlægningsudvalget 2008-09
MPU Alm.del
Offentligt
PwC Sustainability
Collection of statisticalinformation on Green PublicProcurement in the EUReport on data collection results
1
grön.*
grøn.*green.*groen.*
vihreä.*
grün.*
PricewaterhouseCoopers provides sector-specific services in the fields of Assurance, Tax & HRS and Advisory. Our objective is tohelp our clients improve their operational agility – not only as a service provider but also as a business partner. We give practicaladvice, identify opportunities and suggest innovative solutions: with a result-driven focus and often from a surprising perspective.We do this with some 4,800 colleagues in the Netherlands and more than 155,000 people in 153 countries around the world on thebasis of our Connected Thinking philosophy. We serve large national and international companies as well as governments,not-for-profit organisations and private companies.‘PricewaterhouseCoopers’ refers to the network of participating member firms of PricewaterhouseCoopers International Limited.Each member firm is a separate and independent legal entity.
Collection of statisticalinformation on Green PublicProcurement in the EUReport on data collection results
By PricewaterhouseCoopers, Significant and EcofysJanuary 2009
2
PricewaterhouseCoopers
ContentsManagement summary11.11.21.31.41.5
5101111121517
IntroductionBackgroundObjective and scopeMethodologies for measuring GPPMethodology for monitoring GPPContents of this report
22.12.22.32.4
Organising Green Public ProcurementSummaryEnvironmental policyProcurement policyImplementation of Green Public Procurement
1819191920
33.13.23.33.43.53.63.73.8
Green Public Procurement per countrySummaryAustriaDenmarkFinlandGermanyThe NetherlandsSwedenUnited Kingdom
262729303132333435
44.14.24.34.44.54.64.74.84.94.104.11
Green Public Procurement per product groupSummaryCleaning products & servicesConstructionElectricityCatering & foodGardeningOffice IT EquipmentPaperTextilesTransportFurniture
383941424344454647484950
55.15.2
CO2impact of Green Public ProcurementCO2impact of GPP per functional unitCO2impact of GPP in 2006/2007
525353
66.16.2
Financial impact of GPPFinancial impact of GPP per functional unitFinancial impact of GPP in 2006/2007
606162
77.17.27.37.47.5
ConclusionsCurrent Green-7 level of GPPCO2benefits through GPPFinancial benefits through GPPComparison between CO2impact and financial impactReflection and recommendations on the methodology applied
686969697071
AppendixABCDEFGResponse rates per product groupPrecision levels per countryData sheets on organising GPPData sheet on the levels of GPPData sheets on the CO2impact of GPPData sheets on the financial impact of GPPResults verification interviews
72737475829497105
Management summaryBackgroundFor the achievement of sustainable development,changes in production and consumption patterns arecrucial. The European public service spendsapproximately 16% of European Union’s Gross NationalProduct on purchasing a large variety of products. Bytaking into account environmental criteria in itsprocurement procedures, contracting authorities promotemodes of production that are more environmentallyfriendly and stimulate the supply of ‘green’ goods andservices.In the renewed Sustainable Development Strategyadopted in 2006, the leaders of the European Union (EU)have set forth a target for Green Public Procurement(GPP), stating that, by the year 2008, the average level ofGPP should be at the current level of GPP in the bestperforming Member States. This target has been mademore specific in a Commission’s Communicationadopted on 16 July 2008, in which the Commissionproposes a 50% target for each Member State to bereached as from 2010. In September 2008, the EuropeanCouncil called upon the Commission to develop apractical evaluation methodology to measure progressmade by 2010 and thereafter. This study, performed in2008 by PricewaterhouseCoopers, Significant andEcofys, contributes to this need.Netherlands, Sweden and the United Kingdom (‘Green-7’)in 2006/2007. The results are based on a digitalquestionnaire amongst 2907 contracting authorities inthese Member States. The overall response was 1105(38%).For this study, a selection was made of ten productgroups frequently procured by public institutions.Respondents were asked to indicate whether their mostrecently concluded purchasing contracts comply withcertain ‘green criteria’. These criteria are linked to the keyenvironmental impacts of a product and are divided into‘core green’ (addressing the most significantenvironmental impacts) and ‘comprehensive green’ (bestenvironmental products).
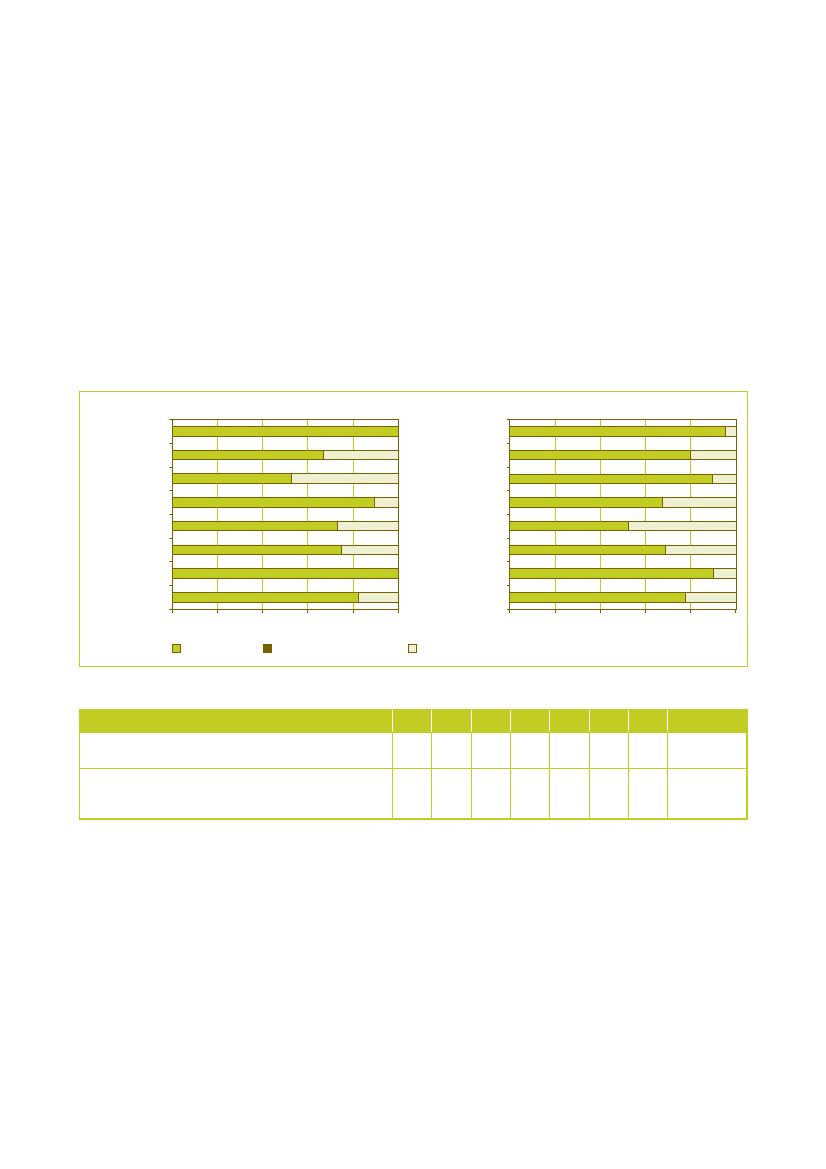
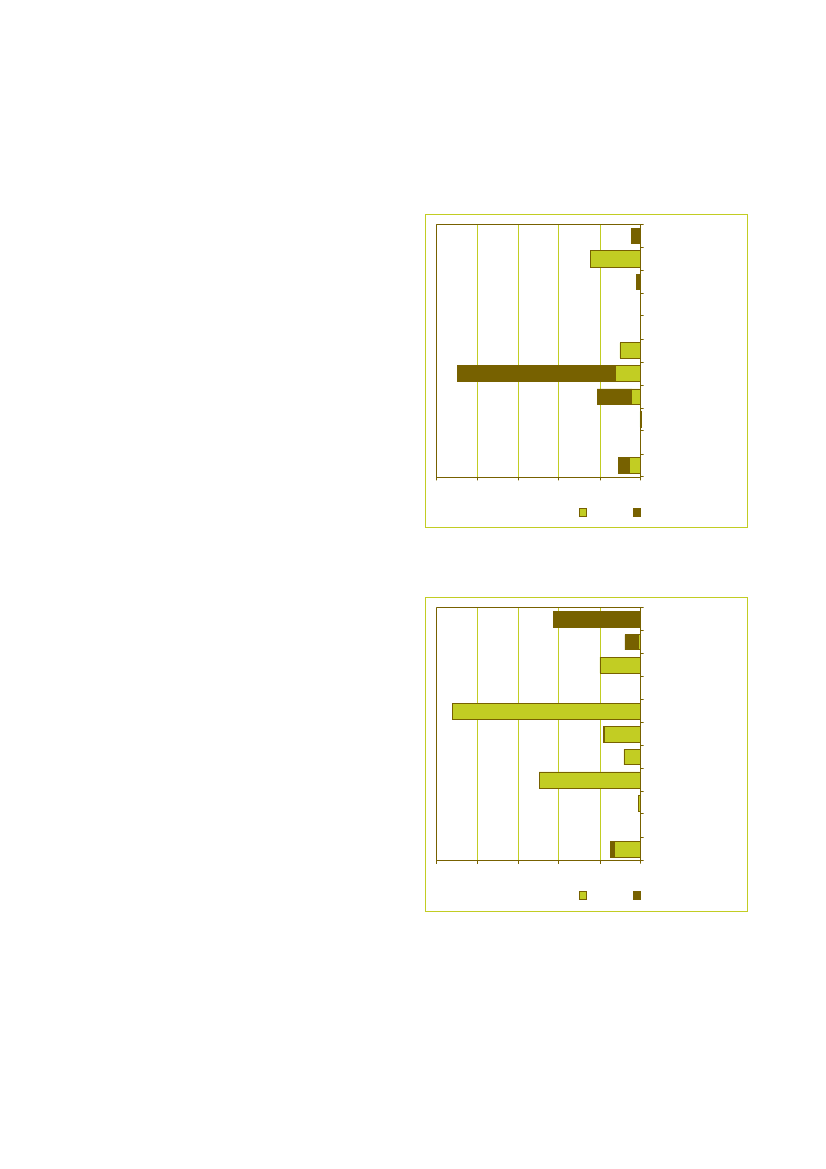
Current levels of GPPIn 2006/2007, efforts undertaken by the Green-7 havelead to an average overall level of 45% ‘green’ of the totalprocurement value (indicator 1) and 55% ‘green’ of thetotal number of contracts (indicator 2). On indicator 1 theUK is the best performing country, scoring a percentageof 74% on GPP, while the Netherlands scores lowest with26%. On indicator 2 Austria performs best with 62% andGermany comes last in line with 46%. Differences inpercentages between the indicators can be explained bythe fact that within indicator 1 a high value contract is ofgreater weight than a low value contract.
Objective and scopeThe main objective of this study is to monitor the currentlevel of GPP in the seven best performing Member Statesby developing and implementing methodologies for:1 Measuring quantitative levels of GPP (numbers andvalue of “green” contracts as compared to overallnumber and value of public procurement contracts)2 Measuring the CO2and financial impact of GPP3 Monitoring GPP in the Member StatesThis report presents the levels and impact of GPPmeasured in Austria, Denmark, Finland, Germany, The
Collection of statistical information on Green Public Procurement in the EU
5
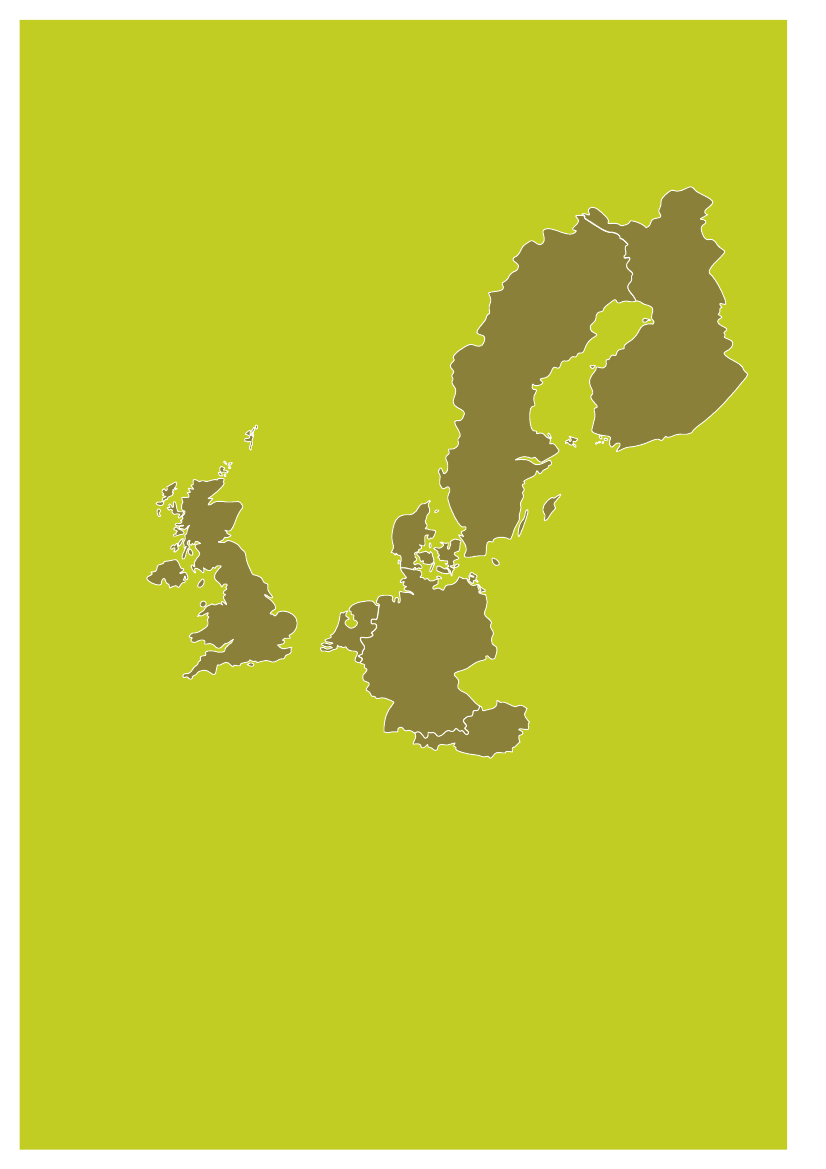
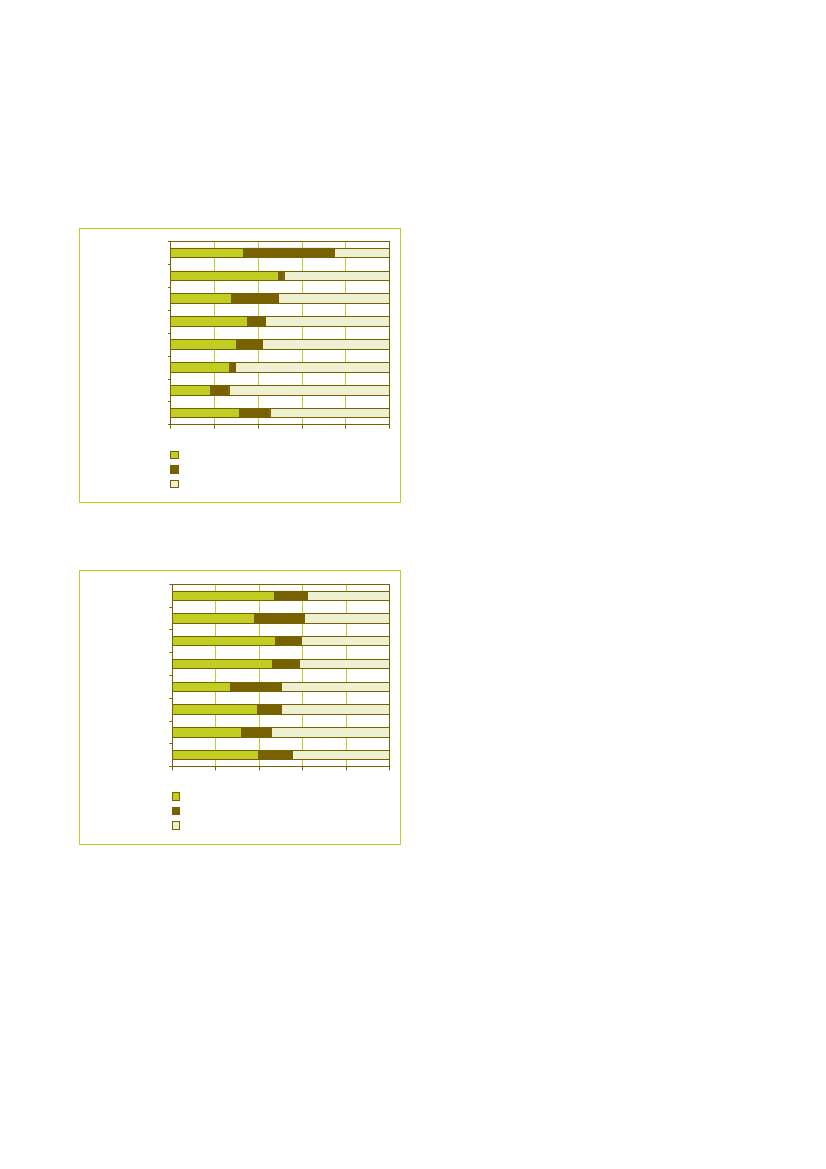
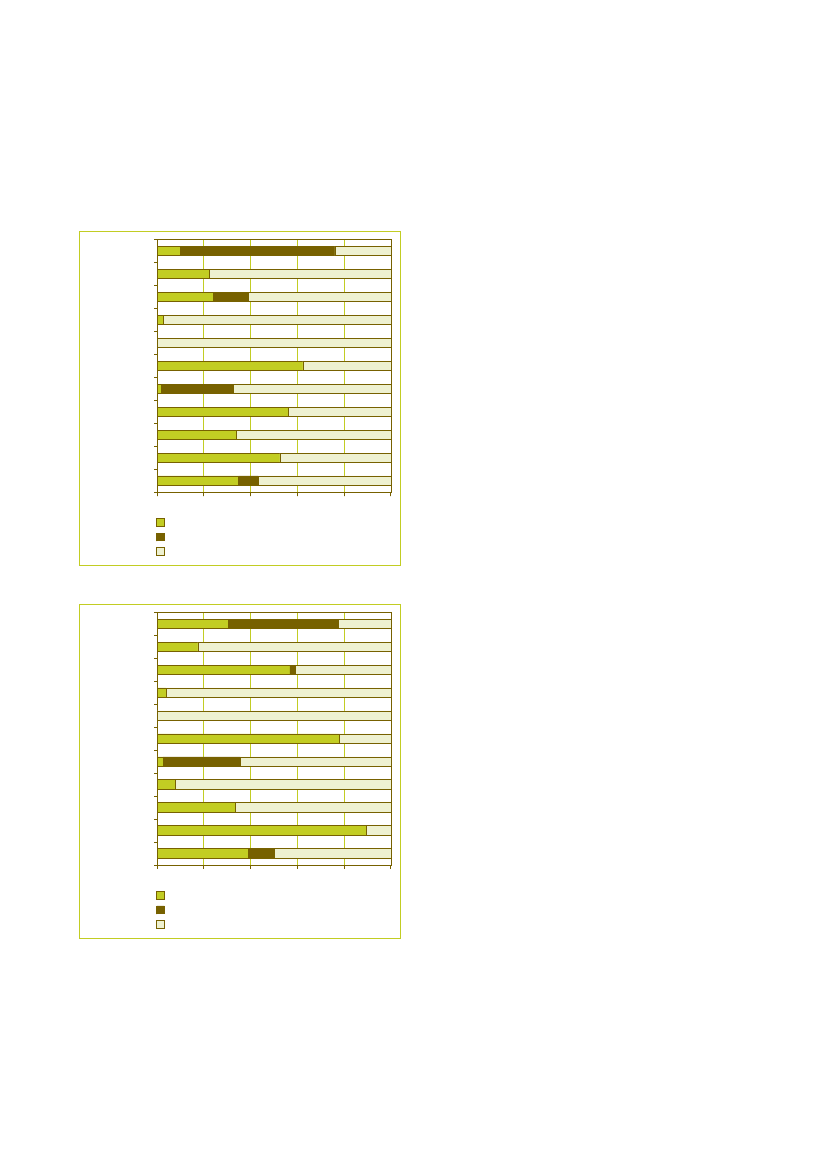
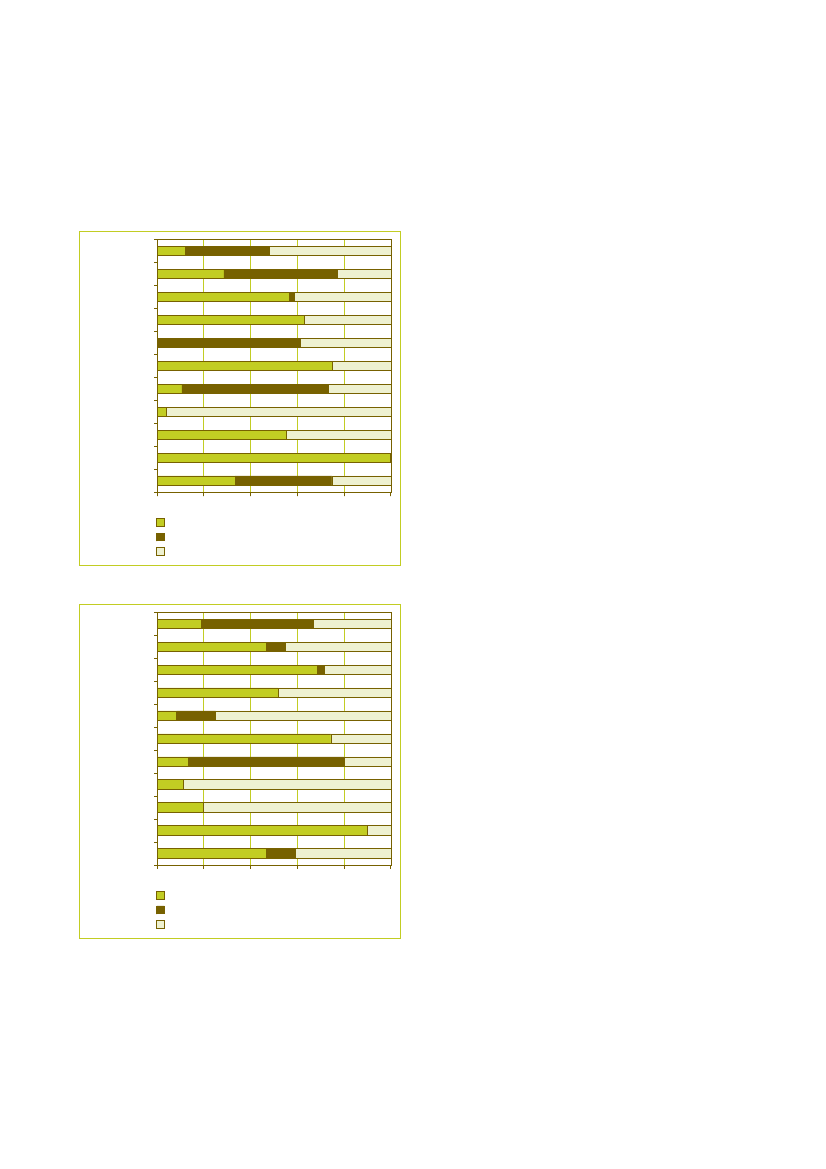
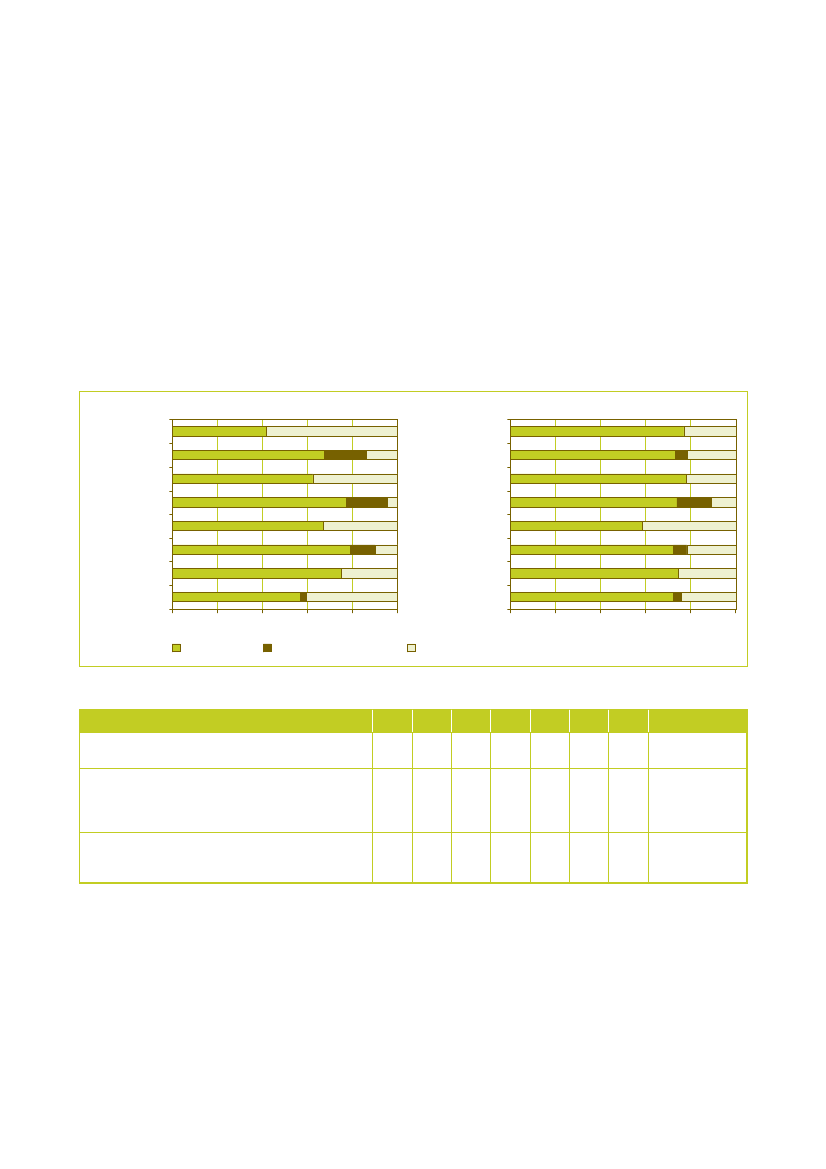
Figure 1: Overall scores on indicator 1United KingdomAustriaSwedenFinlandDenmarkGermany
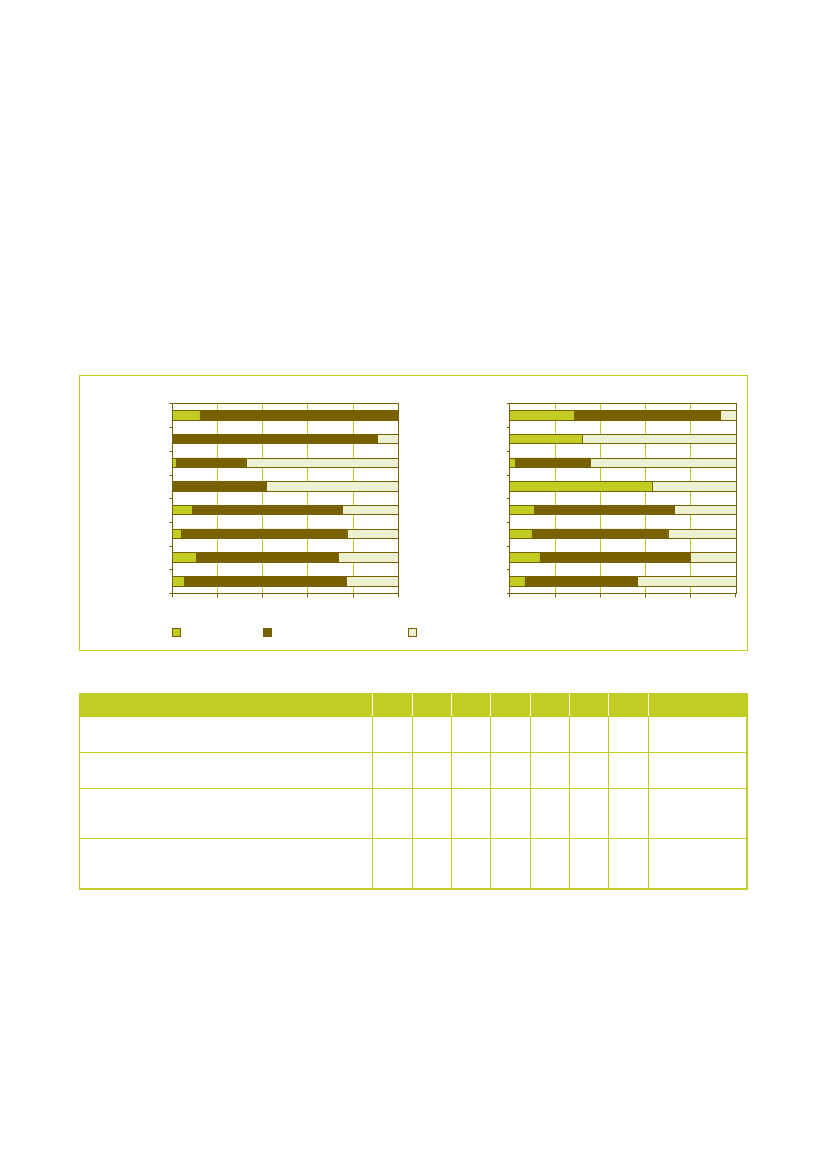
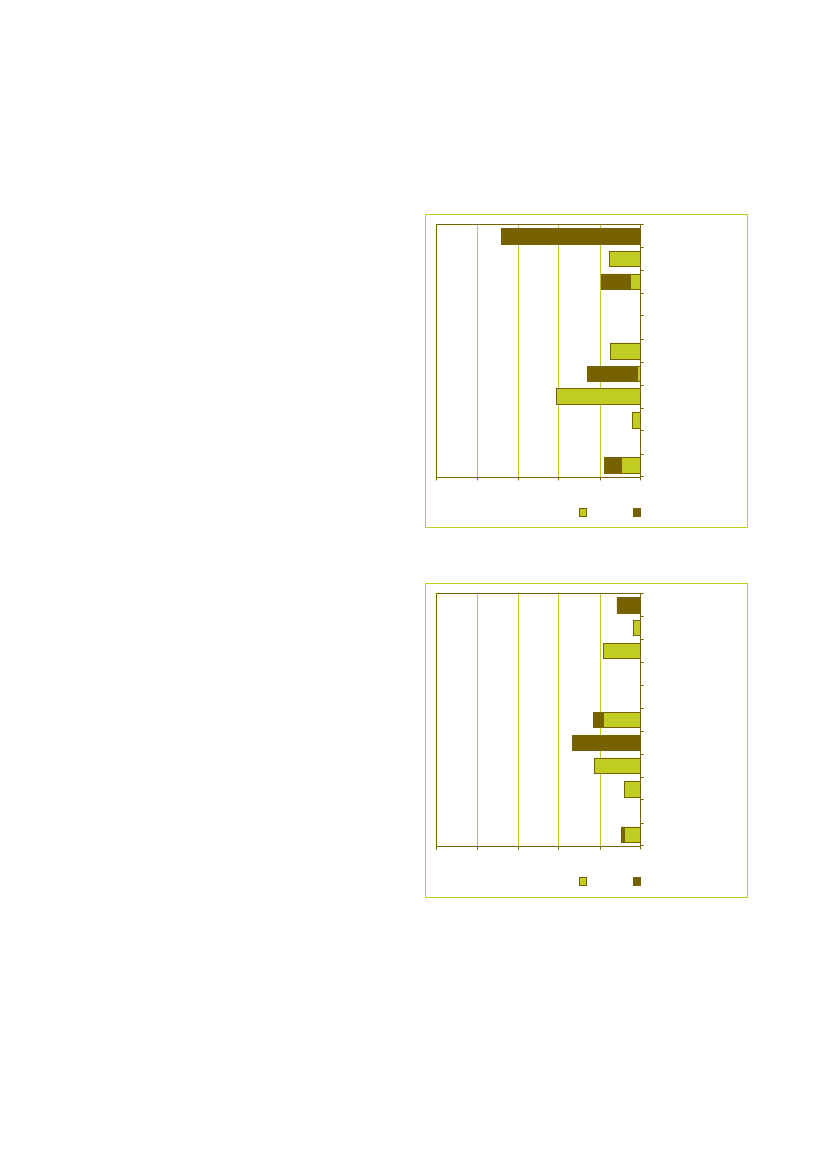
Figure 3: Scores on indicator 1 per product group. Thefigures represent averages of the seven countries underscope.CleaningConstructionElectricityCateringGardening
NetherlandsGreen-7 average0%20%40%60%80% 100%
Office ITPaperClothingTransportFurniture
Core greenComprehensive greenNon green
Figure 2: Overall scores on indicator 2AustriaSwedenUnited KingdomDenmarkNetherlandsFinlandGermanyGreen-7 average0%20%40%60%80% 100%
0%
20%
40%
60%
80% 100%
Core greenComprehensive greenNon green
Figure 4: Scores on indicator 2 per product group. Thefigures represent averages of the seven countries underscopeCleaningConstructionElectricityCateringGardeningOffice ITPaper
Core greenComprehensive greenNon green
Within most countries a wide difference is shown on thelevel of GPP between the ten product groups. Overallelectricity, office IT and furniture attain the highest scoresin 2006/2007; construction, gardening and transport thelowest. Within product groups cleaning and paper, thelevels of compliance with comprehensive green criteriaare highest among all product groups, as can be seenfrom the figures 3 and 4.
ClothingTransportFurniture0%20%40%60%80% 100%
Core greenComprehensive greenNon green
6
PricewaterhouseCoopers
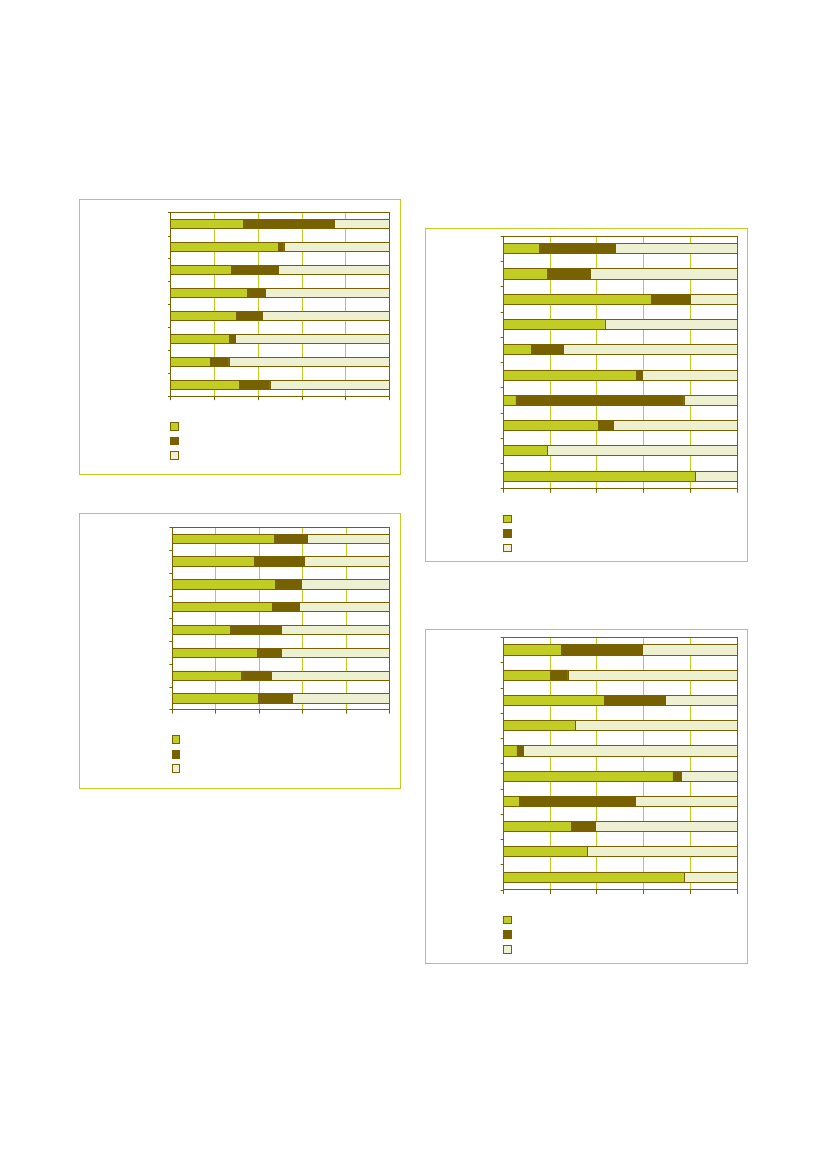
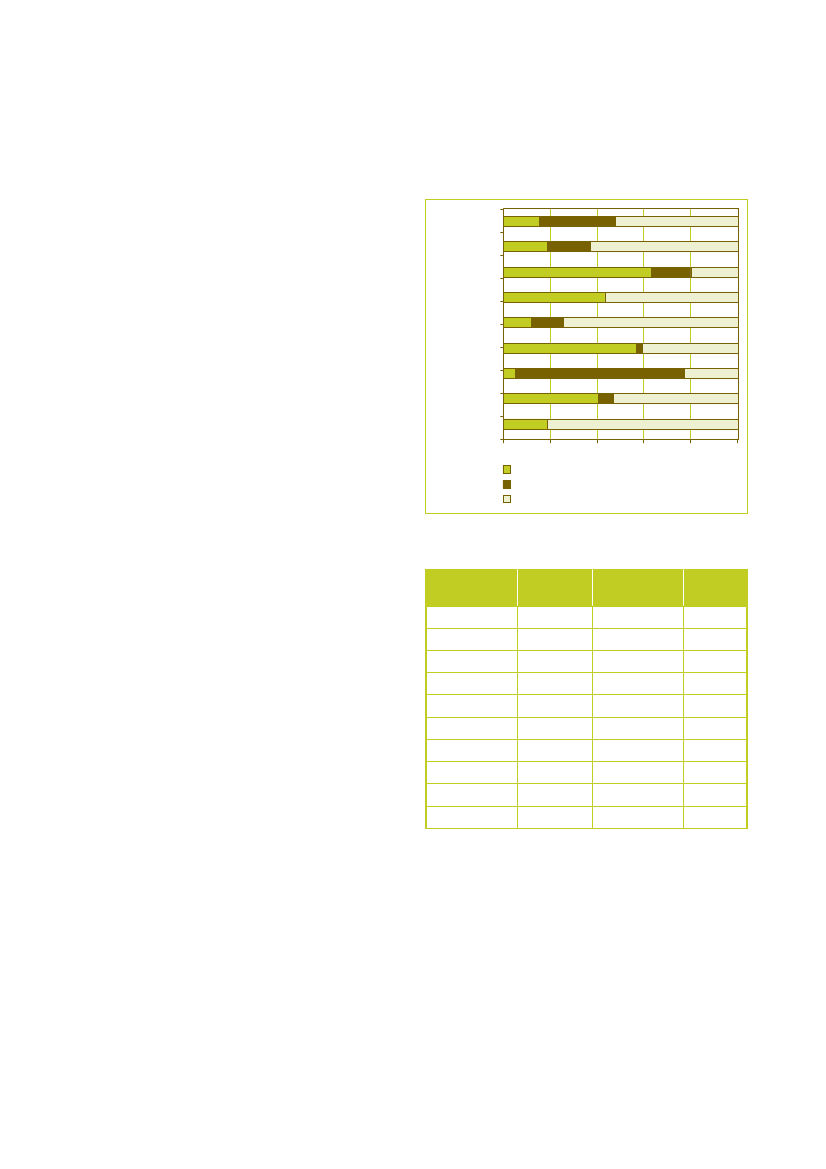
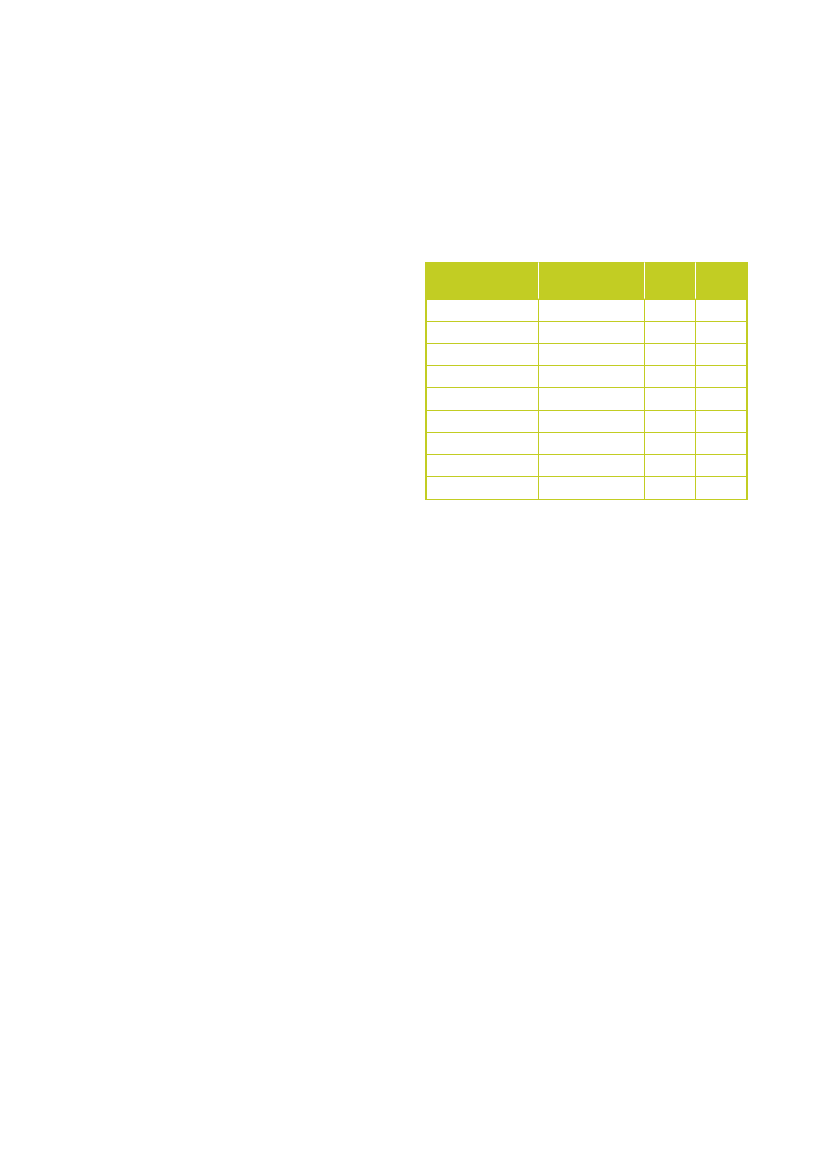
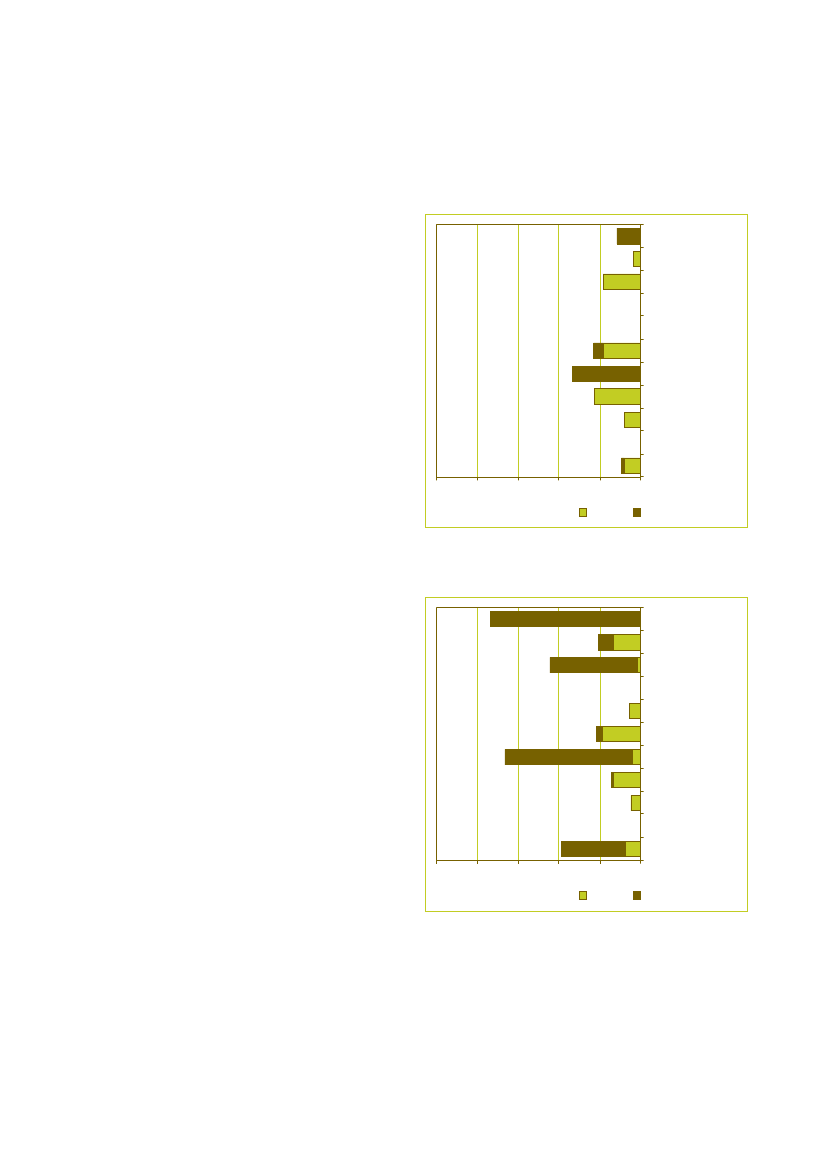
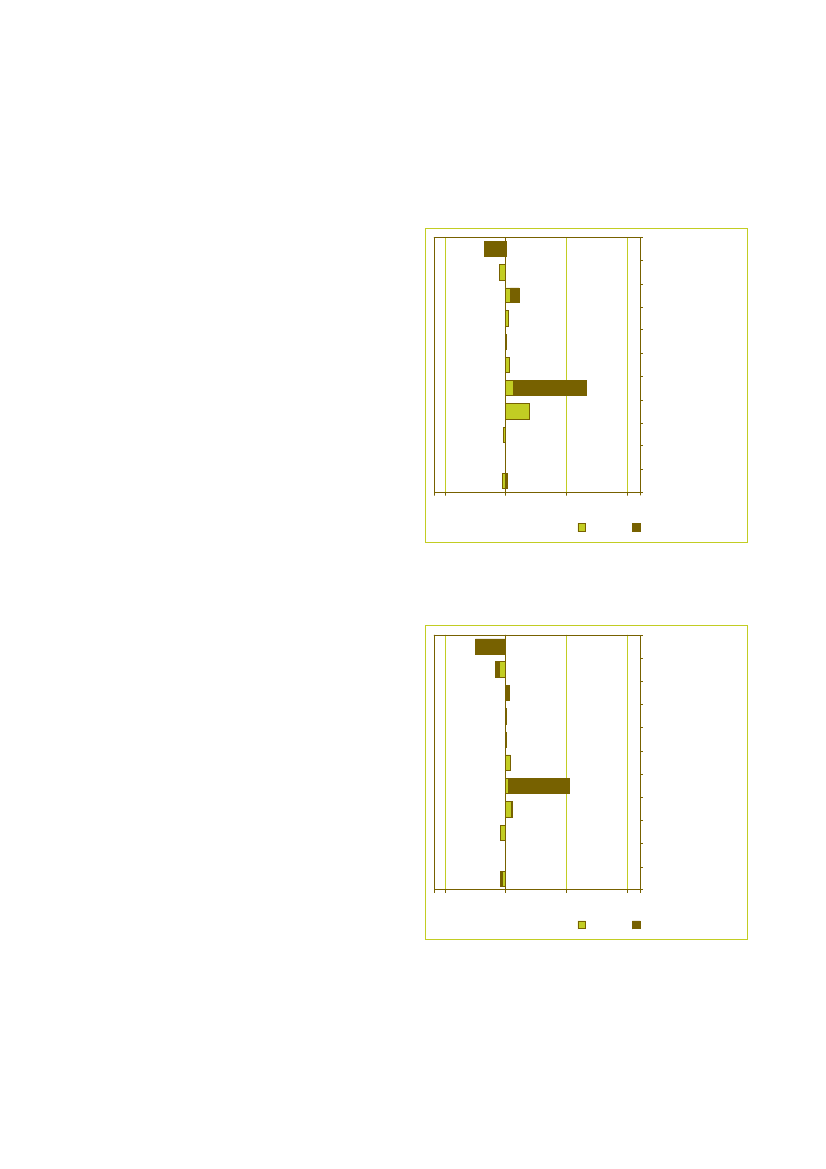
CO2benefits through GPPIt can be concluded that GPP contributes to an averagereduction of CO2emissions of 25% in 2006/2007 whenpurchasing green for the ten product groups subject tothis study. This means that public purchasers have thepossibility to substantially reduce CO2emissions throughGPP. The average CO2emissions impact in 2006/2007varies from -9% in Germany to -47% in the Netherlands,depending on the country-specific levels of GPP perproduct group. Our study shows that for most productgroups, GPP results in a reduction of CO2emissions;construction, gardening, paper and textiles attaining thehighest reduction percentages.Concerning the CO2impact of GPP, the reader shouldnote that the above mentioned figures should beregarded as best estimates, since we have not performedfull Life Cycle Analyses (LCA) in this study. A subsequentstudy could include an LCA for every product group, aswell as an analysis of CO2equivalents. Further, otherenvironmental indicators besides CO2could be studied,such as generation of waste, air pollution or ecotoxicity.Figure 5: CO2impact of GPP per country. Negative numbersimply reductions in CO2emissions
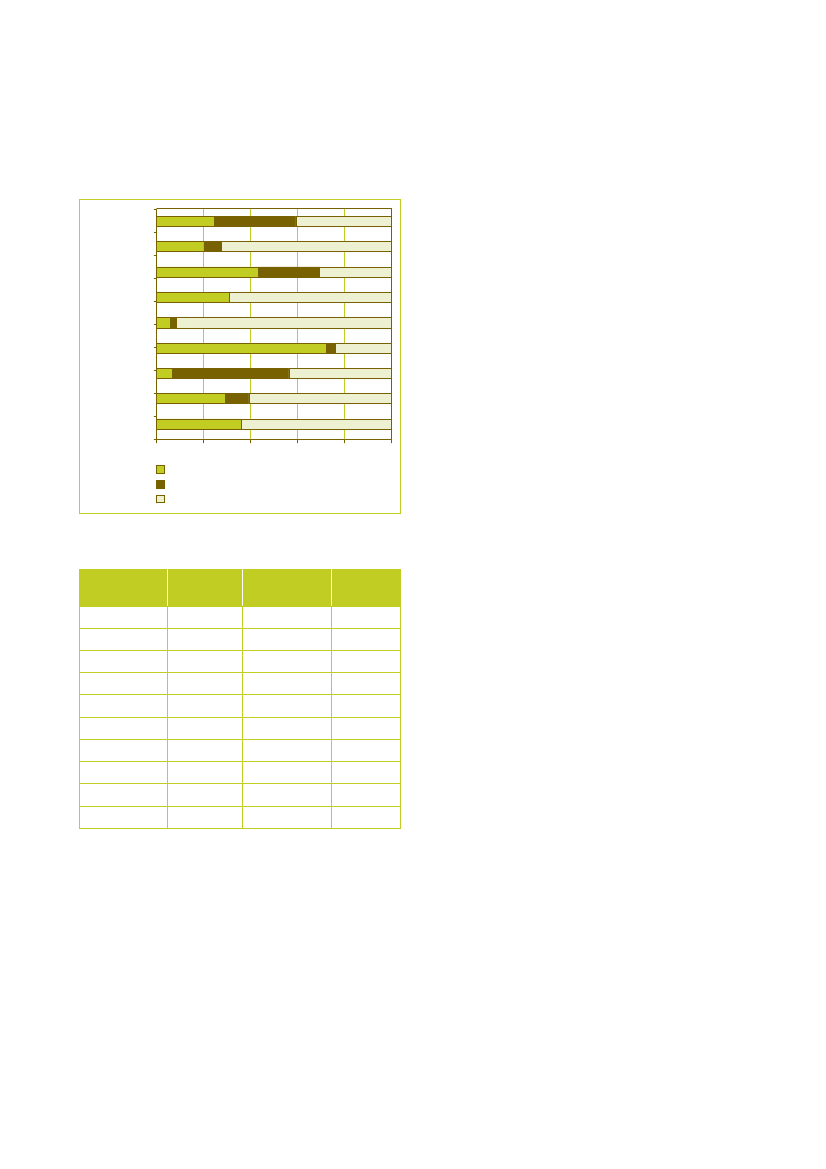
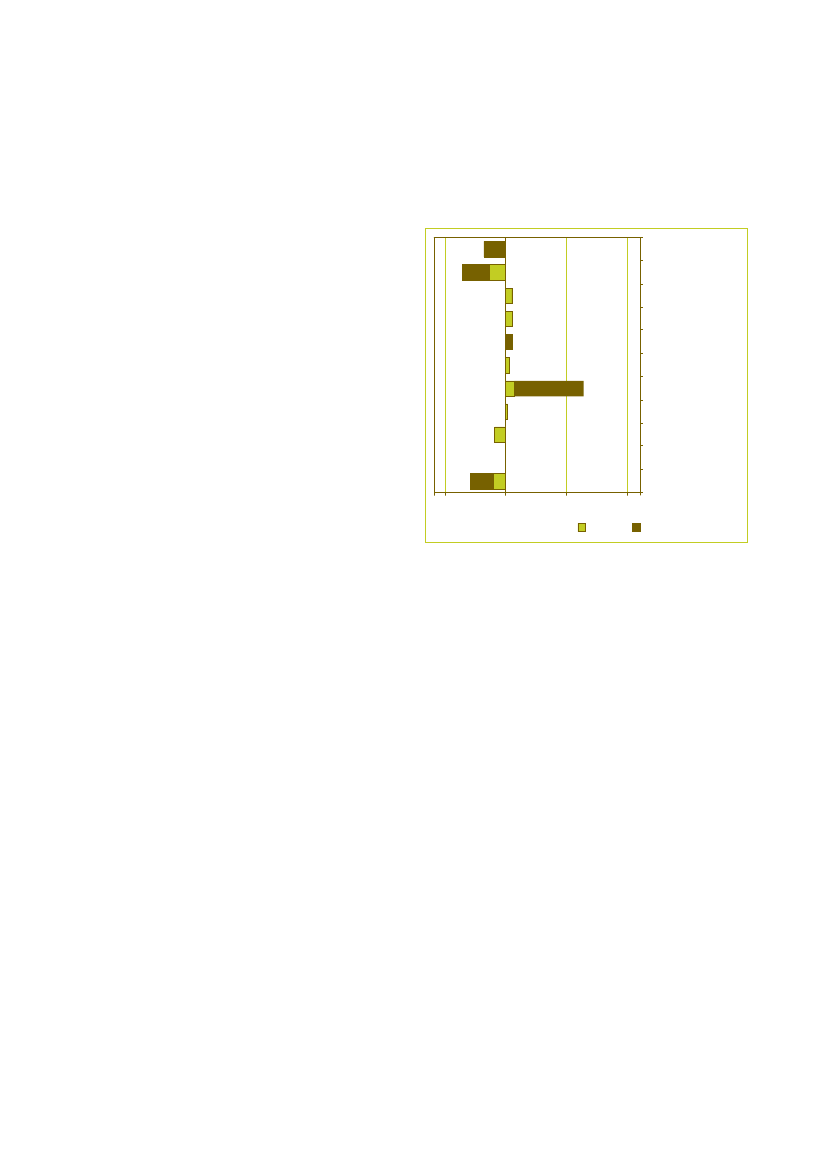
a Life Cycle Costing (LCC) approach in calculating thefinancial impact of GPP, the outcome is that the averagefinancial impact of GPP within the Green-7 is -1% in2006/2007. This means that, although the use ofenvironmental criteria in procurement procedures can leadto higher direct purchasing costs, it can result in anaverage decrease of overall costs for public organisationsof around 1%. The reason behind this is that higherpurchasing prices of green goods are compensated bylower operating costs. From our analysis we can concludethat there are mainly two product groups leading to costreductions through GPP: construction and transport.Figure 6: Financial impact of GPP. Negative numbers implycost reductions and positive numbers imply increases incosts.0,31%-0,17%-0,32%-0,48%-0,79%-1,24%DenmarkNetherlandsGermanyAustriaFinlandSwedenUnited Kingdom
The NetherlandsSwedenUnited KingdomFinlandDenmarkAustriaGermanyGreen-7 average0%-18%-15%-39%
-47%
-5,70%
-1,20%-38%
Green-7 average0%2%
-6%
-4%
-2%
Combination of CO2impact and financial impact-11%-9%-25%-10% -20% -30% -40% -50% -60%
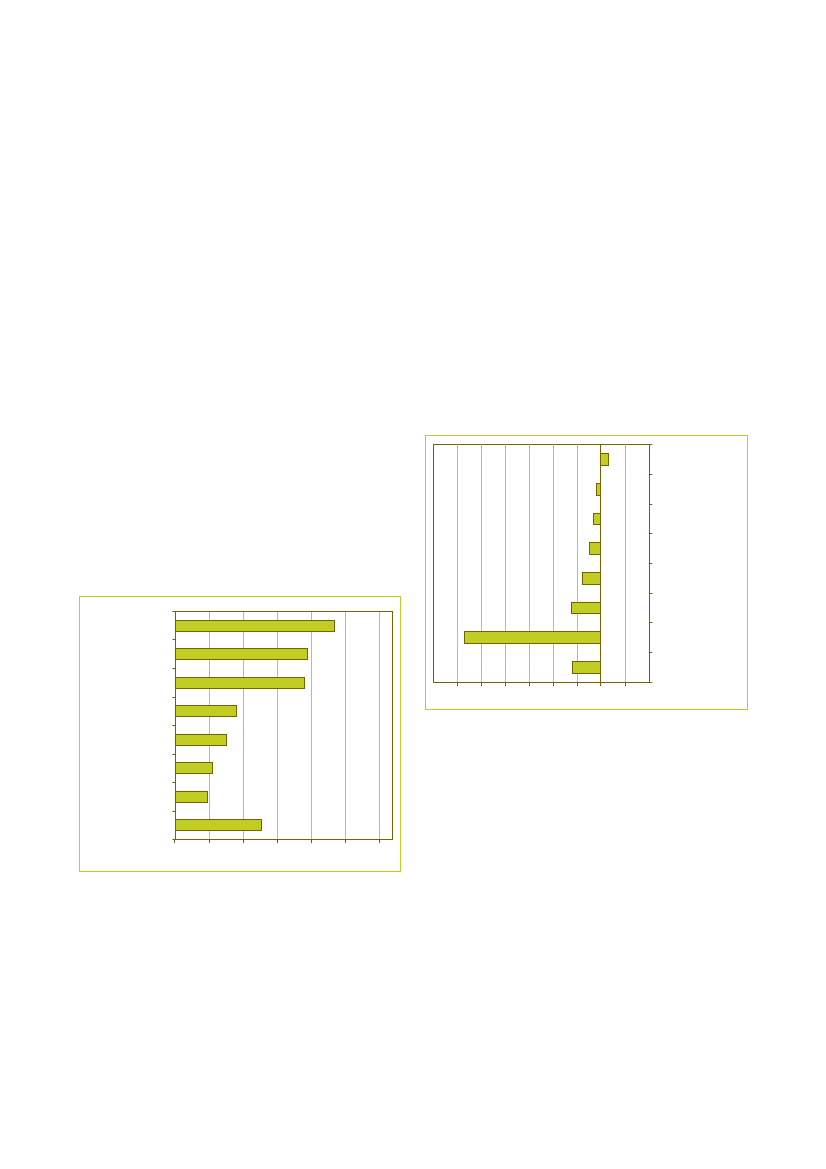
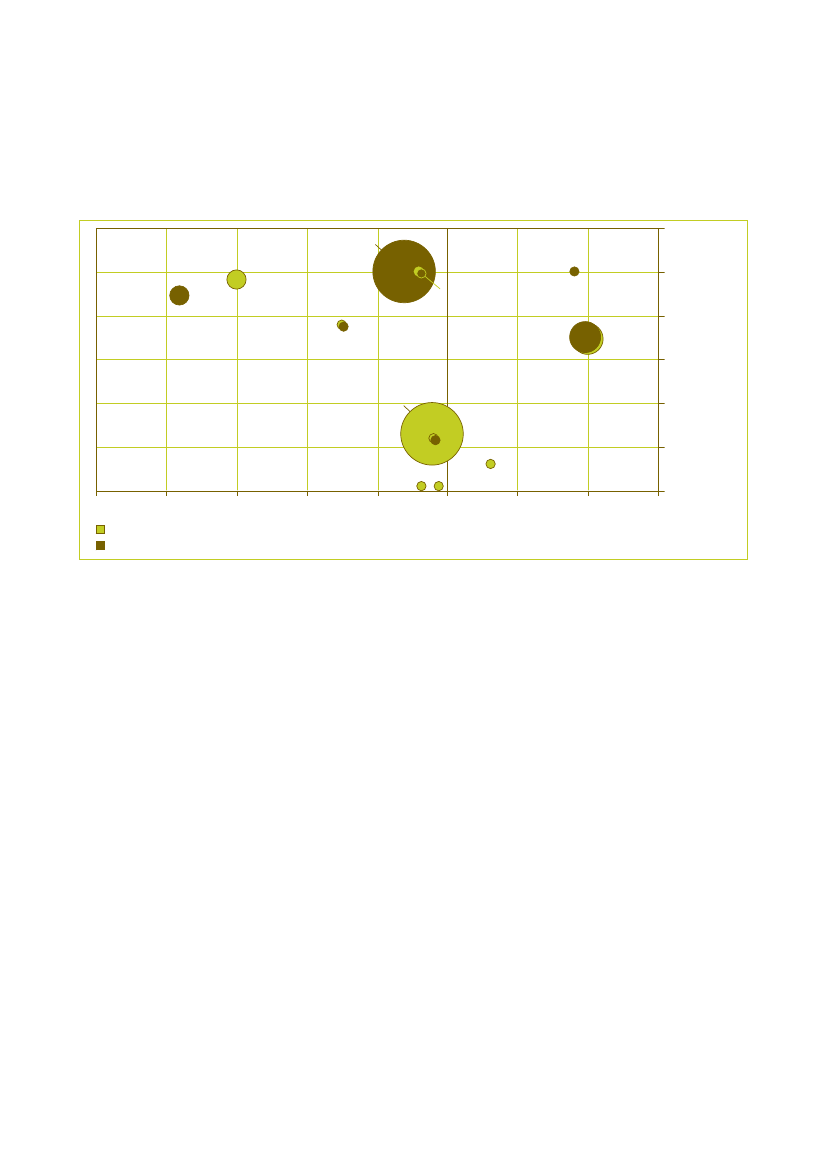
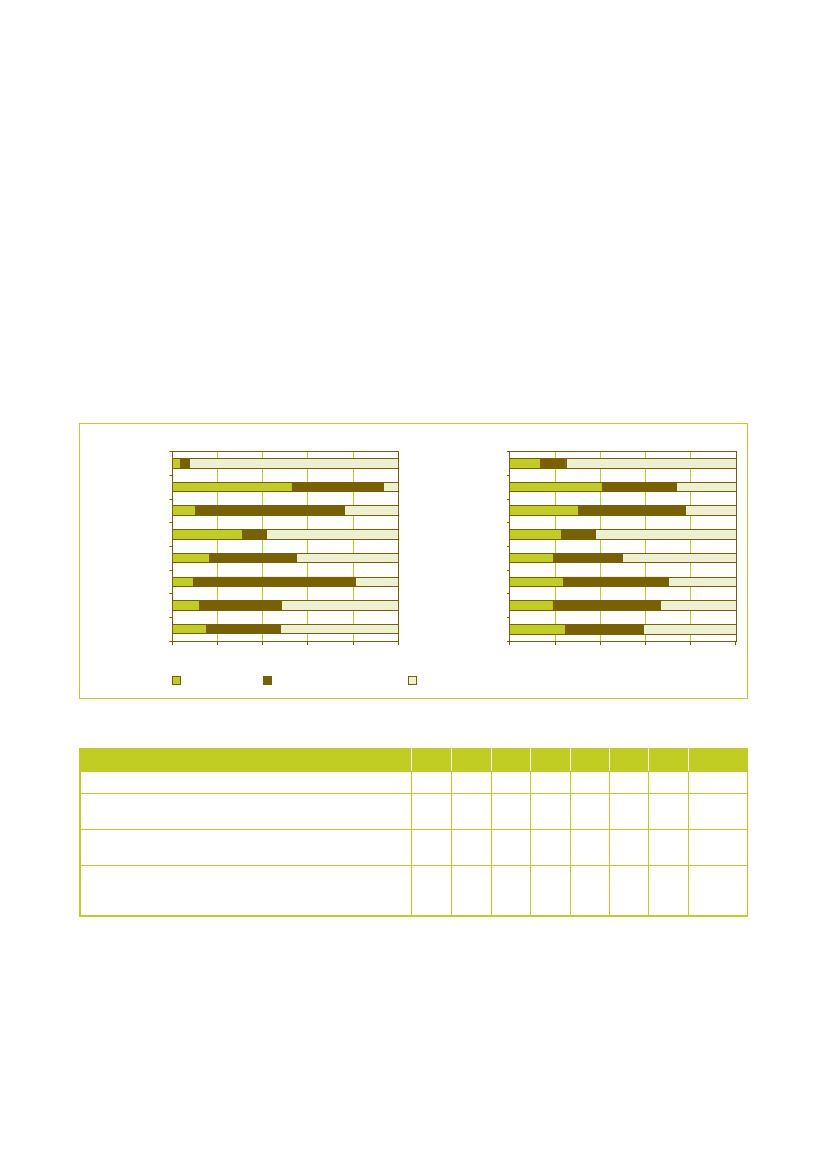
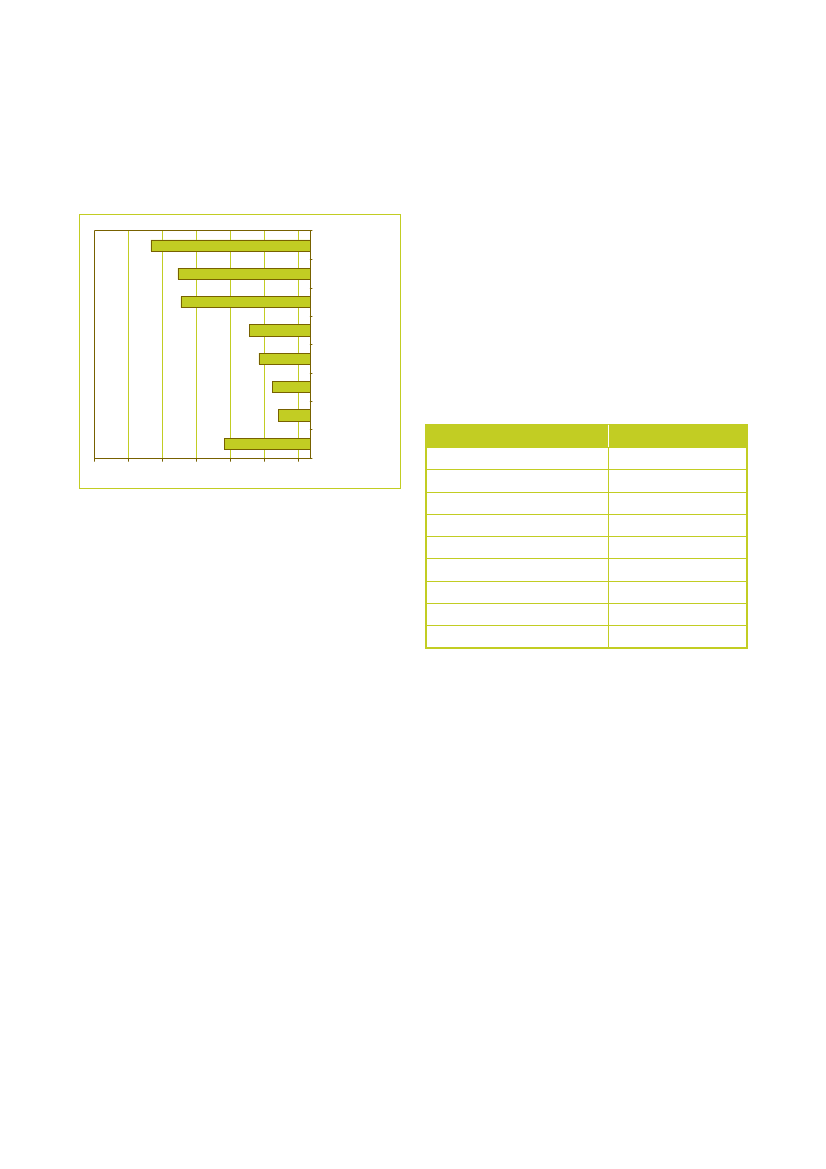
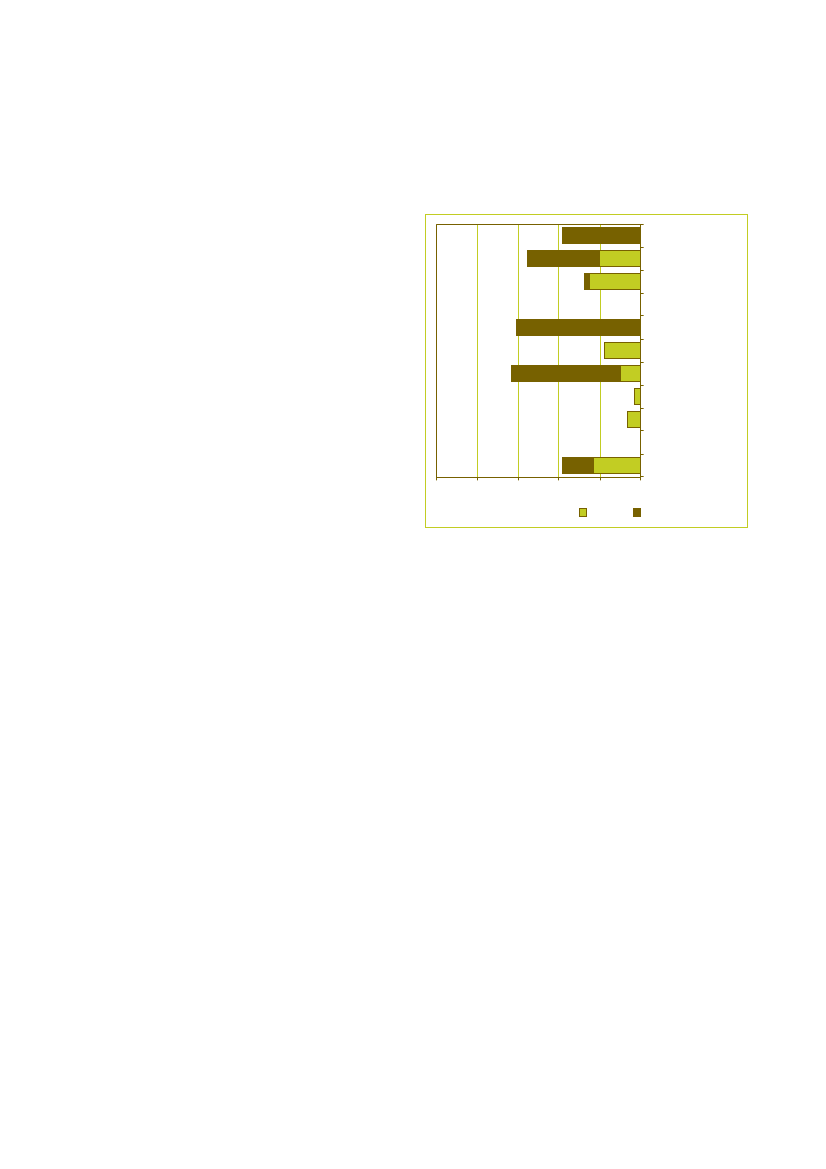
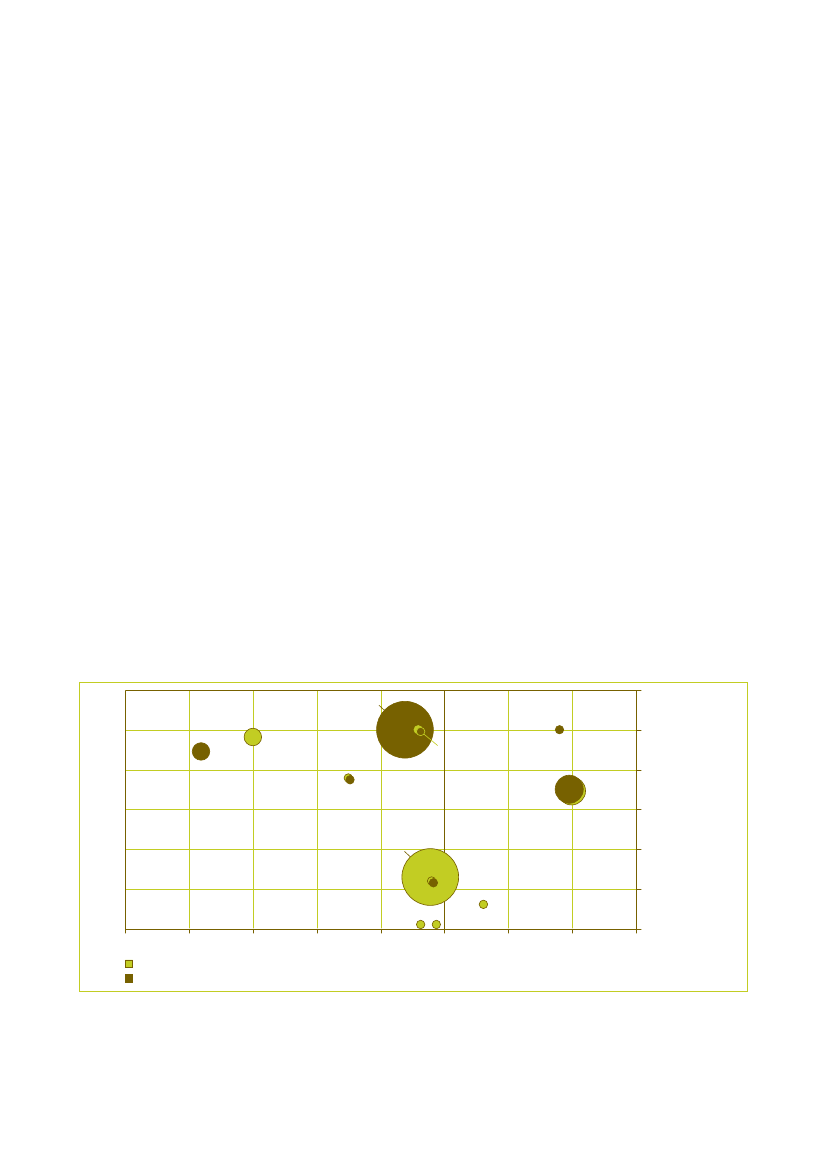
On a product group level, a comparison has been madebetween the CO2impact and financial impact. Since thefunctional unit used for determining both impacts is thesame, we can determine which product group leads toreductions in both CO2emissions and in costs, andwhether this is optimal for core or comprehensive levelsof GPP.The result is that only for transport, construction andcomprehensive green cleaning services, both the CO2impact and the financial impact are negative, as can beseen in figure 7. These are the product groups that publicpurchasers could focus on when implementing GPP.
Financial benefits through GPPIn contrast to common perception, this study shows thatGPP can also lead to decreases in costs for thepurchasing organisation instead of increases. When using
Collection of statistical information on Green Public Procurement in the EU
7
Figure 7: CO2impact and financial impact of GPP per functional unit. Negative numbers imply lower CO2emissions or lowercosts and positive numbers imply higher costs.
electricitycleaningpapergardeningpaperclothingconstruction
-120%
-100%
-80%
-60%
electricityoffice IT
-40%
-20%transportcatering25%20%15%10%5%cleaning0%-5%-10%0%-15%
Core greenComprehensive green
financial impact of GPP per functional unit
However, when also taking into account the product groupthat have the relatively higher CO2emissions (displayed bythe size of the bubbles), construction and electricity are theproduct groups to focus on.
ReflectionOverall, we have found that the use of the questionnaireand sampling has proven to be an adequate tool formeasuring the levels and impact of Green PublicProcurement in a Member State. With limited resourceswe have been able to reach a broad and representativesample population that has provided us with thenecessary data for this study. The methodologies can beapplied to assess statistically sound levels of GPP in allEuropean Members States. What is more, ourmethodology allows for a first estimation of the CO2impact and the financial impact of GPP.
8
PricewaterhouseCoopers
CO2impact of GPP per functional unit
1Introduction
1.1
Background
Green Public Procurement in the EU – Report onmethodologies’.This report includes the results of implementing thedeveloped methodology in the seven best performingMember States, the so-called Green-7, in the second halfof 2008. It presents the levels and impact of GPPmeasured in Austria, Denmark, Finland, Germany, TheNetherlands, Sweden and the United Kingdom. For areflection on the methodology for measuring GPP werefer the reader to the conclusions of this report inchapter 7.
For the achievement of sustainable development,changes in production and consumption patterns arecrucial. The European public service spendsapproximately 16% of European Union’s GNP (GrossNational Product) on purchasing goods such as furniture,office equipment and transport. By taking into accountenvironmental criteria in its procurement procedures, theEuropean Union (EU) can promote modes of productionthat are more environmentally friendly and stimulate thesupply of ‘green’ goods and services on the market.Recognition for the potential of Green PublicProcurement (GPP) as an effective instrument forstimulating sustainable development has grown over thelast few years. In 2003 the European Commission (EC)recommended the Member States to adopt nationalaction plans on GPP before the end 2006. In the renewedSustainable Development Strategy adopted in 2006, theEU leaders have set forth a GPP target, stating that, bythe year 2008, the average level of GPP should be at thecurrent (=2006) level of GPP in the best performingMember States.This target has been made more specific in theCommission’s Communication on public procurement fora better environment adopted on 16 July 2008(COM(2008)400), in which the Commission proposes a 50% target for each Member State to be reached as from2010. This target is linked to a series of priority sectorsand a process to facilitate the implementation of GPP ona European level, including the use of a common set ofgreen criteria and increased information on the benefitsand life cycle costs of environmental friendly products. InSeptember 2008, the European Council welcomed the50% target and called upon the Commission to develop apractical evaluation methodology to measure progress on1GPP made by 2010 and thereafter.This study by PricewaterhouseCoopers, Significant andEcofys aims to contribute to these developments. Amethodology for collecting the statistical data andmonitoring the level of GPP in each Member States wasdeveloped during the first half of 2008. A detaileddescription of this methodology can be found in theseparate report ‘Collection of statistical information on
1.2
Objective and scope
1.2.1ObjectiveThe main objective of this study is to measure the currentlevel of GPP in the seven best performing Member Statesby implementing the developed methodologies.These methodologies include:1 A methodology for measuring quantitative levels ofGPP (numbers and value of “green” contracts ascompared to overall number and value of publicprocurement contracts)2 A methodology for measuring the CO� and financialimpact of GPP3 A methodology for monitoring GPP in the MemberStatesThe monitor has been implemented in a broad range ofpublic and semi-public, central and non-central (i.e.regional and local) institutions in the seven participatingMember States. A detailed overview of the type of publicinstitutions included in this study can be found in theseparate report on methodologies - section 4.1.1.2.2Selected product groupsThe variety of products procured by European publicinstitutions is broad. Products consumed, used andinvested in by a public institution are subject to publicprocurement. This can range from paper to a computer,from cars used by civil servants to the purchase of publicinfrastructure. For measuring the level of GPP a selectionwas made of ten product groups frequently procured bypublic institutions. The product groups are the same asthe product groups for which a product sheet in the GPP2Training Toolkit has been developed. Secondly for eachproduct group a representative product type was
12
Council Conclusions on public procurement for a better environment. Council meeting, Brussels, 25 September 2008For the GPP training toolkit please go to http://ec.europa.eu/environment/gpp/toolkit_en.htm
Collection of statistical information on Green Public Procurement in the EU
11
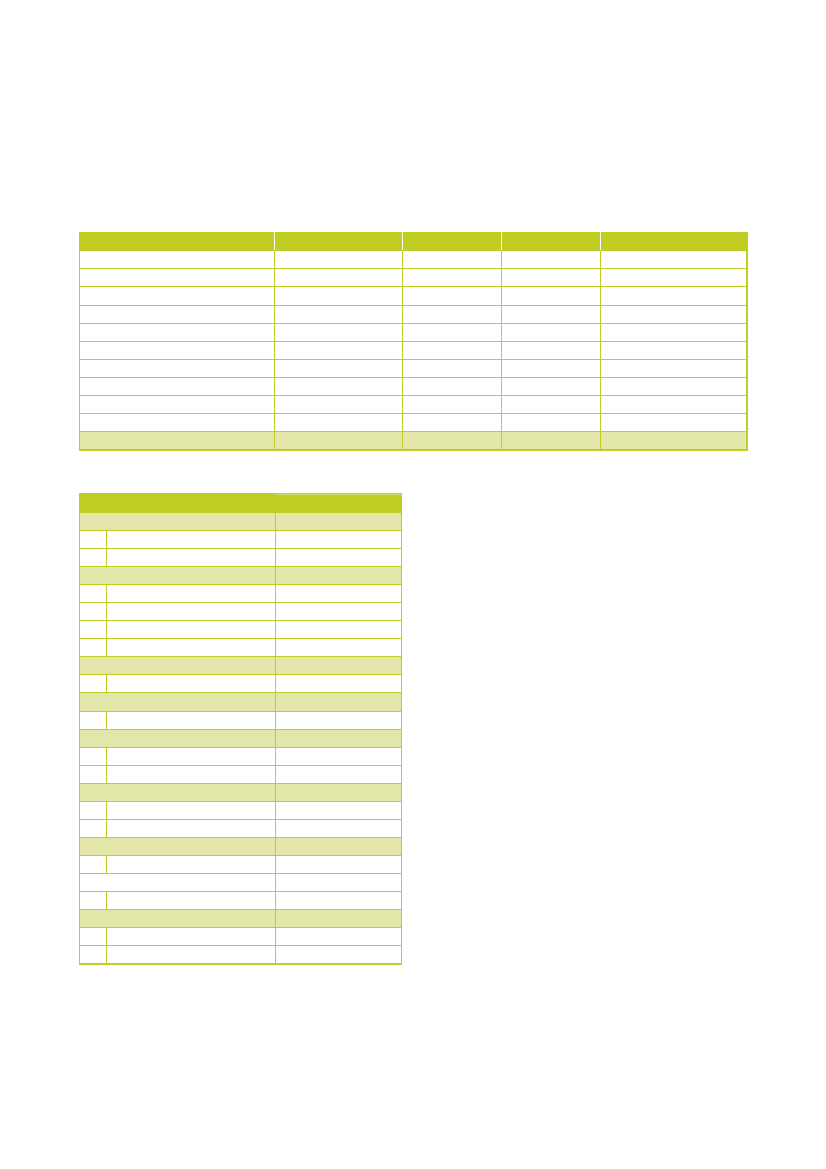
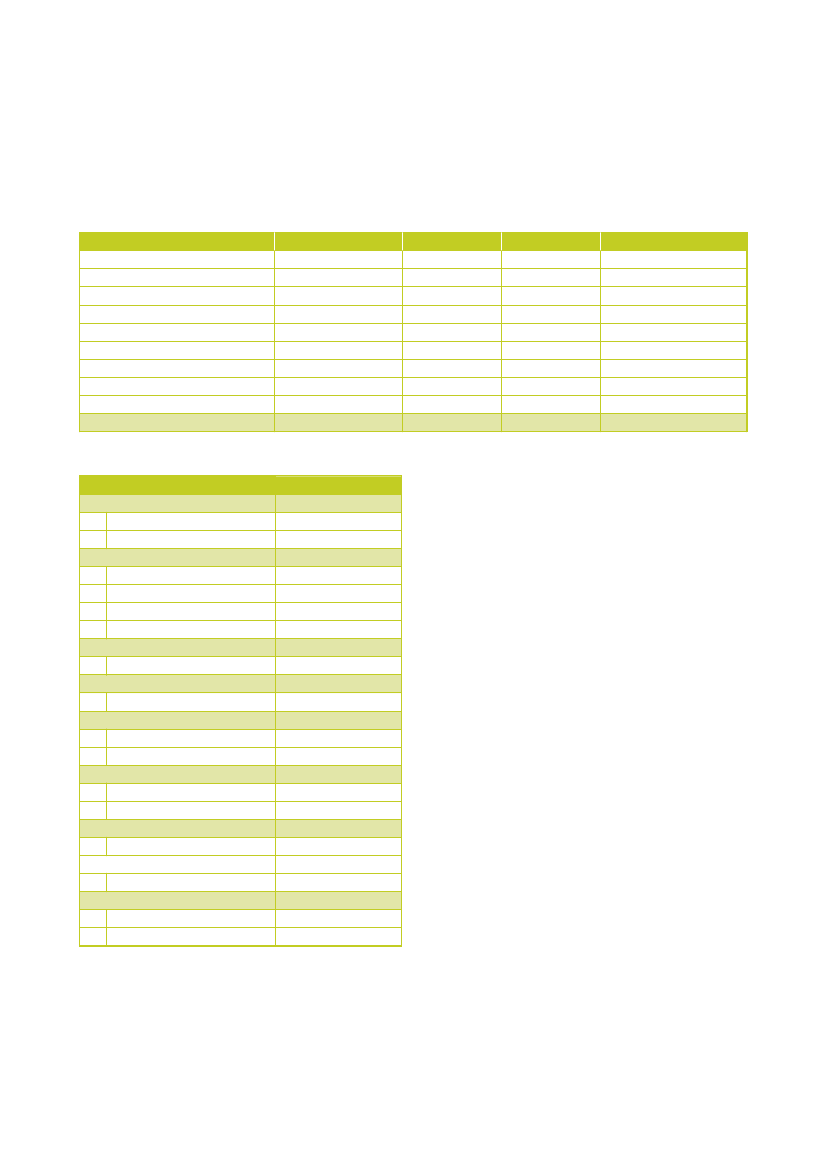
identified. The selection procedure of these ten productgroups and types is described in the separate report onmethodologies - section 1.3.1.Table 1.1: Selected product groups with related producttypesProduct group1Cleaning products &servicesConstructionElectricityCatering & FoodGardeningOffice IT EquipmentPaperTextilesTransportFurnitureProduct typeCleaning services(including cleaningproducts)New buildings & officesElectricityCatering services(including food)Gardening services andmachineryComputers (desktops &laptops) and monitorsCopying & graphic paperClothingPassenger cars and lightduty vehiclesOffice furniture
Definition of GPP3:“Green Public Procurement (GPP) is a processwhereby public and semi-public authorities meet theirneeds for goods, services, works and utilities byseeking and choosing outcomes and solutions thathave a reduced impact on the environment throughouttheir whole life-cycle, as compared to comparableproducts/solutions. A procurement procedure will beconsidered as ‘green’ only if it has led to the purchaseof a substantively ‘greener’ product and only if theenvironmental characteristics of this product gobeyond what needs to be complied with on the basisof European or national environmental legislation.”
2345678910
1.3
Methodologies for measuring GPP
This definition focuses on the process of greenprocurement and defines a green product as a productwith specific environmental characteristics. In order togive procurement officers more guidance in identifyinggreen products, a practical GPP Training Toolkit wasdeveloped by the European Commission. This toolkitdescribes in detail which product characteristics define aproduct as green. These ‘green criteria’ are linked to thekey environmental impacts of a product and are dividedinto ‘core green’ (addressing the most significantenvironmental impacts and/or easy to verify) and‘comprehensive green’ (best environmental productswhich may require more efforts to procure in terms ofverification).It has not been considered appropriate to examinecompliance with all training toolkit criteria at this stage,considering the fact that the training toolkit was not yetpublicly available at the time of the launching andconclusion of the contracts subject to the monitoringexercise. However, in the future, monitoring will be basedon compliance with the core criteria of the training toolkit.In table 2 we give an overview of the selected productgroups and green criteria which have been applied in thisstudy.
1.3.1Defining GPPFor measuring the level of green in public procurementpractices, a clear and measurable definition of GreenPublic Procurement is needed. The definition of GPP asformulated by the European Commission is as follows:
3
Collection of statistical information on Green Public Procurement in the EU. Invitation to tender, May 2007. Reference ENV.G.2./SER/2007/0038
12
PricewaterhouseCoopers
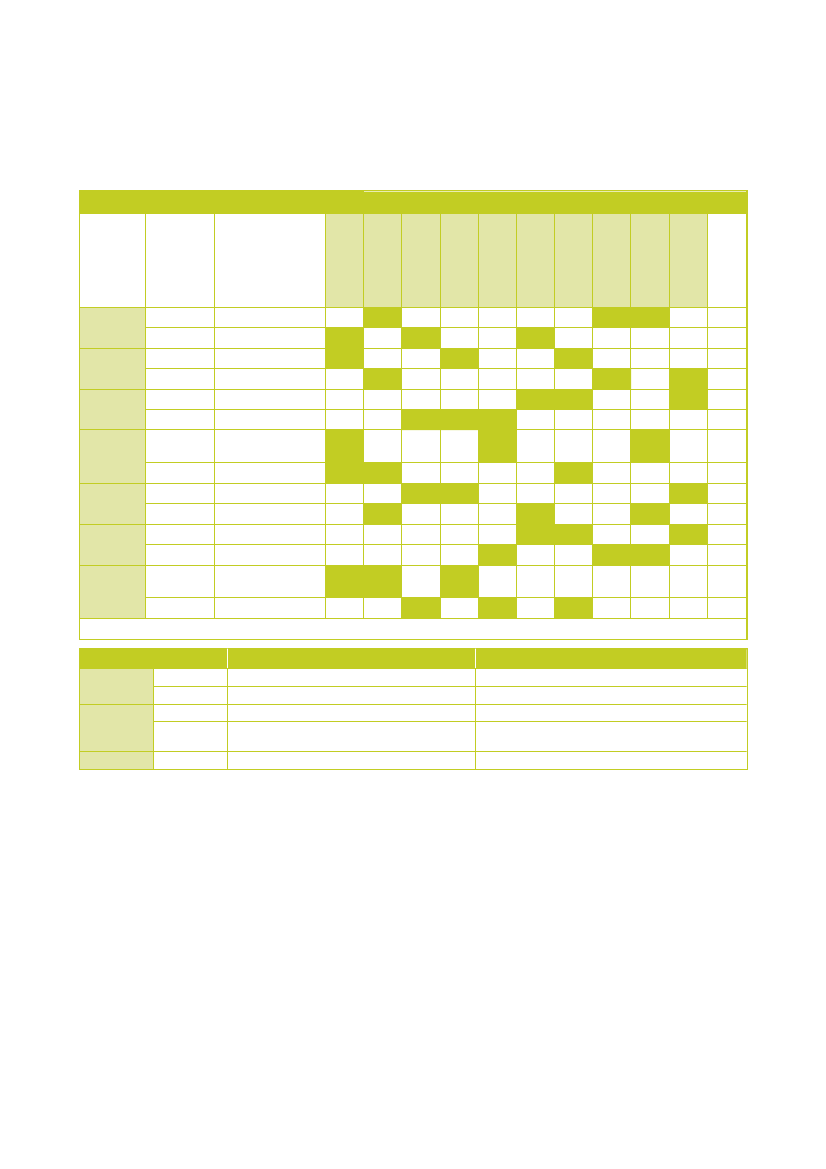
Table 1.2: Selected product groups and green criteria (core &comprehensive)Product group1Cleaning products& servicesProductCleaning services(including cleaningproducts)New buildings &officesCore criterial
Comprehensive criteriall
Use of cleaning products without hazardoussubstances
Training of employeesUse of reusable microfibercloths and/or dry-cleaningtechniquesUse of localized renewableenergy sources
2
Construction
llll
Consideration of energy-saving measures indesign and usage phase of buildingWater-saving technologies in kitchen andsanitary facilitiesUse of materials without hazardoussubstancesUse of timber from legal sources50% or higher electricity from renewableenergy sourcesorganic production of food productsUse of seasonal fruit, vegetables and fishFuel type use of gardening machinesUse of soil improvers without peat andsewage sludgeEnergy star standardsAccessibility and changeability of memory,hard disks and/or CD/DVD drivesProduction from recovered paper fibresUse of ECF/TCF paperPulp production from sustainably managedforests for paper based on virgin fibresÖko-Tex Standard 100Maximum CO2-emissions per vehicle segmentEuro 5 standardUse of wood from legally sourced timber andsustainably managed forests
l
345
ElectricityCatering & foodGardening
ElectricityCatering services(including food)Gardening servicesand machinery
l
l
100% electricity fromrenewable energy sources
llll
*
6
Office IT equipment Computers (desktops& laptops) andmonitorsPaperCopying & graphicpaper
ll
*
7
lll
*
8910
TextilesTransportFurniture
ClothingPassenger cars andlight duty vehiclesOffice furniture
llll
*
* No comprehensive criteria were included in the questionnaire, however the following labels and standards filled in by the respondentshave been classified as comprehensive: EU Ecolabel (all), Blaue Engel and Nordic Swan (Office IT equipment and Paper), TCO 05(Office IT equipment).
Collection of statistical information on Green Public Procurement in the EU
13
1.3.2Measuring the level of GPPThe level of Green Public Procurement is measuredbased on two indicators:ll
Indicator 1: % GPP of total public procurement interms of monetary valueIndicator 2: % GPP of total public procurement interms of the # of contracts
sample (for a product group). To have an average forGPP per country, the percentages per product grouphave been combined into one weighted percentage ofcomprehensive / core level contracts covering all tenproduct groups. When doing so, the weights awarded tothe different product groups have been based on theproportion of each product group within the total amountof purchasing (larger product groups outweighing thesmaller ones).Indicator 2 has been calculated by dividing the totalnumber of comprehensive and core level contracts in thesample by the total number of contracts in the sample(for a product group). Comparable to indicator 1, thepercentages per product group have been combined intoone weighted percentage for all ten product groups. Inorder to do so, the weights of the different productgroups are based on how many times a product grouphas been filled in by the sample population per country.Results of this study on indicators 1 and 2 are presentedin chapter 3 and 4 of this report. Chapter 3 includescomparisons between countries, chapter 4 comparisonsbetween product groups at country level.For a more detailed description of the definitions andmethods for calculating indicator 1 and 2 we refer to theseparate report on methodologies – chapter 2.1.3.3Measuring the impact of GPP
In our calculations for both indicators the distinctionbetween core green and comprehensive green has beentaken into account.Indicator 1 indicates the percentage of the amount ofmoney spent on green public procurement, compared tothe total amount spent on public procurement. Indicator 2indicates the percentage of the number of greencontracts, compared to the total annual number ofcontracts.The data used for the calculation of indicator 1 and 2 wasprovided by the contracting authorities that participatedin our study. This data was collected through an onlinequestionnaire. Information was asked on the total annualprocurement value (€) and the green criteria used in themost recent contract within each product group. Theyears of reference are 2006 and 2007. This means thatthe respondents have been asked to fill in thequestionnaire for the most recent purchasing contractconcluded in 2006/2007. The contract informationreceived for each product group represents all purchaseswithin that product group over the last two years. Thatmeans that if the most recent contract is consideredgreen, then 100% of the total annual value is consideredgreen.The resulting total percentage level of green per productgroup per country represents the percentage level ofgreen public procurement for the entire public sector inthat country. We have applied a sampling methodallowing us to base ourselves on the results from oursample population for calculating the levels of GPP forthe whole population (see also section 1.4.1). The resultsfrom the sample population have been corrected so thatthe proportion of central and de-central organisationsaligns with the actual proportions in the total population.Indicator 1 has been calculated by dividing the totalamount (€) of comprehensive and core level purchases inthe sample by the total amount (€) of purchases in the
Indicator 3: % CO2impact of GPPBecause of the current public awareness on climatechange, the correlation between CO2emissions fromhuman activity and global warming, and taking intoaccount the availability of data, indicator 3 focuses on theimpact of GPP on CO2emissions. Criteria are beingapplied that relate to reduced CO2emissions in aproducts’ life cycle. Indicator 3 is calculated bycomparing the CO2emissions of a green product withthose of a non-green product.Because of the complexity and resource intensity of thecalculations as well as the limited data available, themethod applied has several limitations which should bementioned beforehand:1. CO2equivalents are not included (i.e. we do notconvert emissions of other greenhouse gases such asmethane into CO2equivalents)2. Climate change is only one of the variousenvironmental impacts
14
PricewaterhouseCoopers
3. The study does not include a full Life Cycle Analysiswhich would allow to identify the most importantenvironmental impact based on a life cycleperspectiveOur analysis focuses on the production and/orconsumption phase which has the most CO2impact.From the GPP Training Toolkit, criteria have beenselected that allow for distinguishing between the CO2impact of a green and a non-green product. CO2relatedcriteria which make a distinction between core andcomprehensive levels of GPP were only available forelectricity, construction, cleaning services and paper.After having selected the criteria, non-green and greenproducts have been identified meeting those criteria, foreach product group. A so-called CO2ratio has beencalculated for each product as follows:a Selection of a functional unit for every product group2(e.g. number of computers or m floor cleaned);b Determination of CO2emissions per functional unit,both for the green and a non-green product withineach product group;c For those product groups of which the calculation of4the CO2emissions is partly based on energy use , wemake us of country-specific CO2emissions per kWhfor all countries under scope.The CO2ratio determines the CO2impact of GPP perfunctional unit of a product group. If we link this CO2impact per functional unit to the results of indicator 1, wecan determine for all countries the CO2impact of GPP in2006/2007. For more details on this calculation, we referto the separate report on methodologies. Results of thisstudy are presented in section 5.1 of this report. Wepresent comparisons between countries, as well ascomparisons between product groups at country level.Indicator 4: Financial impact of GPPThe financial impact of GPP is calculated by comparingthe costs of a green product with those of a non-greenproduct. Our analysis is based, as far as possible, on theconcept on Life Cycle Costs (LCC). This means that wedo not only take into account costs that result from thepurchase of a product or service, but also operationalcosts and costs for disposal. Thus, the financial analysisis performed for all stages of the life cycle that are relatedto the user of a product.
For each stage, we have determined so-called costratios, which are defined as the ratio of costs of a greenproduct as compared to the costs of a non-greenproduct. This is done both for core and comprehensivelevels of GPP. A cost ratio of 0.90 for a certain product ina certain stage of the life cycle means that a greenversion of this product leads to 10% lower costs at thisstage than the non-green version.When calculating cost ratios within the various stages ofthe life cycle of a product group, it becomes clear thatnot all stages account for the same percentage of thetotal cost for the user of a product. For example,operational costs of a computer during its 4-year life arelower than costs of purchasing. For this reason, we havedetermined the so-called costs structures for everyproduct group, in which we determine the percentagethat every element contributes to the total costs.The cost ratios for all relevant life cycles stagesdetermine, together with the cost structure, the financialimpact of GPP per functional unit of a product group. Ifwe link these results of our analysis to the results ofindicator 1, we can determine the actual financial impactof GPP in 2006/2007. For more details on this calculation,we refer to the separate report on methodologies. Theresults of this study are presented in section 5.2 of thisreport. We present comparisons between countries, aswell as comparisons between product groups at countrylevel.
1.41.4.1
Methodology for monitoring GPPSurveying and sampling methods
SurveyingThe instrument we used for collecting the data for thisstudy is an online questionnaire. The questionnaire wassent to a contact database including 2907 contractingauthorities in the seven participating Member States.These contacts were identified through (a) the personalnetwork of the research team within each of the sevenMember States; (b) the national purchasing associations;(c) GPP contact databases and (d) the Tender ElectronicDaily (TED) database.
4
These product groups are: construction (electricity use of a building), electricity, office IT equipment (electricity use of a computer or monitor, paper(electricity use during pulping process).
Collection of statistical information on Green Public Procurement in the EU
15
The questionnaire consisted of three sections A, B and C.Section A covered general questions on the respondentand his organisation. Section B included questionsconcerning the environmental policy, procurement policyand the implementation of green procurement in theorganisation. The answers to these qualitative questionsgive us information on the relationship between thebehaviour and the results of respondents. The mostvaluable insights for this study are presented in chapter 2of this report. Section C of the questionnaire containedquestions about the use of green criteria (based on theGPP training toolkit) within the most recent procurementcontract. In addition, section C contained questionsconcerning the total amount of money an organisationhas spent on a product group during the last fiscal year.The questionnaire was online from the 4th of June untilthe 31st of August 2008. During that time, response-increasing methods were applied to make sure asufficiently high response was achieved. Actions takenincluded:a) Clear communication to respondents.Announcements in relevant newsletters were placedand an announcement letter signed by the ministerresponsible for environmental affairs and/or the EChead of unit Environment and Industry. A projectwebsite was launched containing information and aFAQ list about this study.b) Professional help desk. Five days a week aprofessional helpdesk was available for questions andsupport in filling out the questionnaire.c) Reminders per email and telephone. One invitation andfour reminders were sent out per email. In total 1.360calling sessions were performed, 50 to 400 callingsessions per country. In countries where the responserate kept behind, respondents were stimulated extrathrough emails and relevant networks.VerificationIn order to verify the answers given in the questionnairewe selected 14 respondents, 2 per Member State, for averification interview by telephone. With the selection ofrespondents a balanced distribution of product groupsand type of institution was taken into account. In total 14interviews were performed, of which 2 central, 10 local, 1regional and 1 semi-governmental authority have beeninterviewed in the seven Member States. For an overviewof the outcomes we refer to Appendix G.SamplingThe sampling method used in this study aims to collectdata which is representative for the total population of
public institutions. This way, valid statements on the leveland impact of GPP can be made for the complete publicsector based on the data received from our samplepopulation. For this we determined the necessary grosssample size (number of questionnaires to be sent out) toreach the required net sample population (actual numberof respondents) based on:lActual number of public institutions in all countries.lEstimated response rates per country (based onexperiences with similar surveys).lA 20% precision level (a measure of the uncertainty ofthe estimated level of GPP that we find acceptable tomake statistical statements. We vary this precisionlevel in order to define an optimal, a base and apessimistic scenario.)lA confidence level of 95% (The level of uncertainty ischosen such that we can have a 95% confidence thatthe true level of GPP lies within the boundaries of theprecision level.)The base scenario with a 20% precision level has arequired total net sample size (# respondents) of 635.Apart from this an optimistic and pessimistic scenariowere sketched. In the optimistic scenario a total netsample size of 794 gives a precision level of 17%. Thepessimistic scenario has a total net sample size of 476and a precision level of 23%.As is shown in the separate report on methodologies, therequired net sample size differs per country, dependingon the total population size of that country. Thedifferences is a very small, even though there are greatdifference in the total population size. This is a result ofthe fact that from statistical theory, we found thatalthough there is a relation between the size of thepopulation and the required net sample size, theinfluence is not very high. For more explanation on thenumbers and definitions used in the sample size we referto the report on methodologies – chapter 4.Aiming at a 20% precision level, 2.907 contacts (thecalculated gross sample size) at public institutions wereidentified and received our questionnaire. Based on theactual response the precision levels per country werecalculated. This required a complex calculation takinginto account the spreading on central and non-centrallevel and was based on the actual respondents with atleast one contract in a product group in section C. For anoverview of the response rate numbers per productgroup per country we refer the reader to Appendix A.
16
PricewaterhouseCoopers
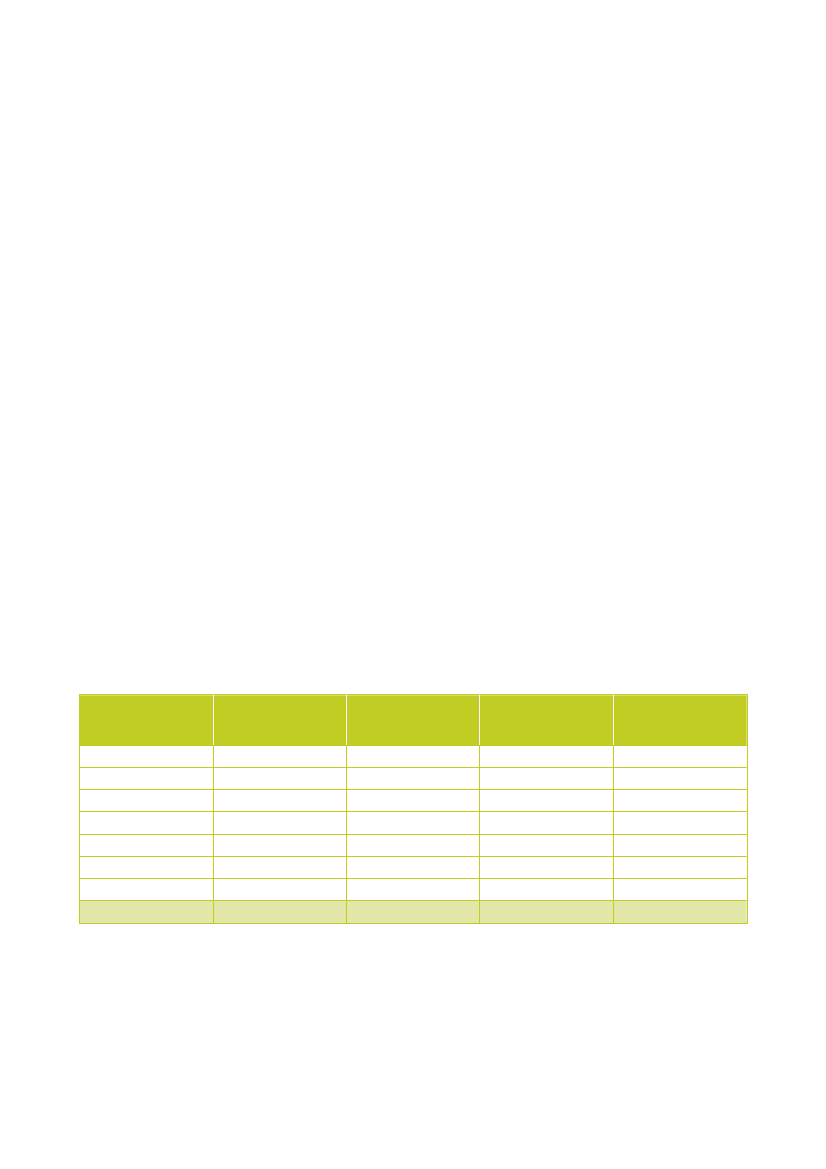
From the actual response, we have found that withachieved precision levels we can make statistically soundstatements on the level of GPP for all countries onindicator 2 and for three countries on indicator 1. For this,a maximum precision level of 20% has been taken intoaccount in order to make valid statement from astatistical point of view. On indicator 2, a very optimisticscenario was reached with precision levels lower (i.e.better) than 17% for all countries. On indicator 1,Denmark, The Netherlands and Sweden scored optimisticprecision levels of 17% or lower (i.e. better). Austria,Germany, Finland and UK however did not reach thepessimistic scenario with precision levels higher (i.e. notbetter than 23%). The differences in precision levelbetween these countries are explained by the number ofrespondents: Germany, Finland and UK achieved a lowerresponse rate than Denmark, The Netherlands andSweden. The precision levels for indicator 2 are betterthan indicator 1 because of the wider spreading of thedata on procurement values (indicator 1) than thespreading of data in number of contracts (indicator 2). Forthe exact precision levels per country (broken down forcore and comprehensive levels as well) we refer toAppendix B of this report.1.4.2Overall response ratesThe table below gives an overview of1) the number in sample: total of 2.907,
2) the number of respondents: the number ofrespondents that filled in section B of thequestionnaire as a minimum,3) the response rate: the percentage of responsescompared to the sample size,4) the number of organisations that respondentspurchase on behalf of: in each country there areseveral purchasing organisations that purchase onbehalf of other public institutions. These so-calledcentralized purchasing organisations have filled in thequestionnaire on behalf of more than one institution.
1.5
Contents of this report
This report provides an overview of the results of thecollection of data on Green Public Procurement in theseven participating Member States. In chapter 2 theresults of section B of the questionnaire (concerning thequalitative questions) are presented. They give us anindication of the level of implementation of GPP policy inthe participating organisations. Chapter 3 shows us themain results on the quantitative levels of Green PublicProcurement per country. Chapter 4 includes some moredetailed results per product group. Chapters 5 and 6present the results on the impact of Green PublicProcurement, respectively on CO2and financially. In thefinal chapter 7 overall conclusions are drawn on all resultspresented.
Table 1.3: response ratesCountryNo. in sampleNo. ofrespondents3843413874904144304612.90713690162103248267991.105Response %No. of organisationsrespondents purchaseon behalf of35%26%42%21%60%62%21%38%1551672461512663081131.406
AustriaDenmarkFinlandGermanyThe NetherlandsSwedenUnited KingdomAll countries
Collection of statistical information on Green Public Procurement in the EU
17
2OrganisingGreen PublicProcurement
The progress of Member States on Green PublicProcurement has been measured by means ofquantitative, result-oriented indicators (indicator1 and 2). Chapters 3 and 4 deal with the resultsof these indicators. In addition, thequestionnaire which was used for this study,contained a set of qualitative, process- andpolicy-oriented questions. The answers to thesequestions show what measures have been takenby governmental organisations to attain acertain level of GPP. This gives some indicationof future ‘GPP-potential’. In this chapter wepresent the results of this process-oriented partof the questionnaire, for each of the sevenseparate Member States. The questions arerelated to the environmental and procurementpolicies of governmental organisations, and onthe implementation of GPP. Appendix C includessome results on background information andbreakdowns of results between central andnon-central organisations.
procurement process, are the environmental impact ofthe purchase, and the availability of and the familiaritywith green alternatives.
2.2
Environmental policy
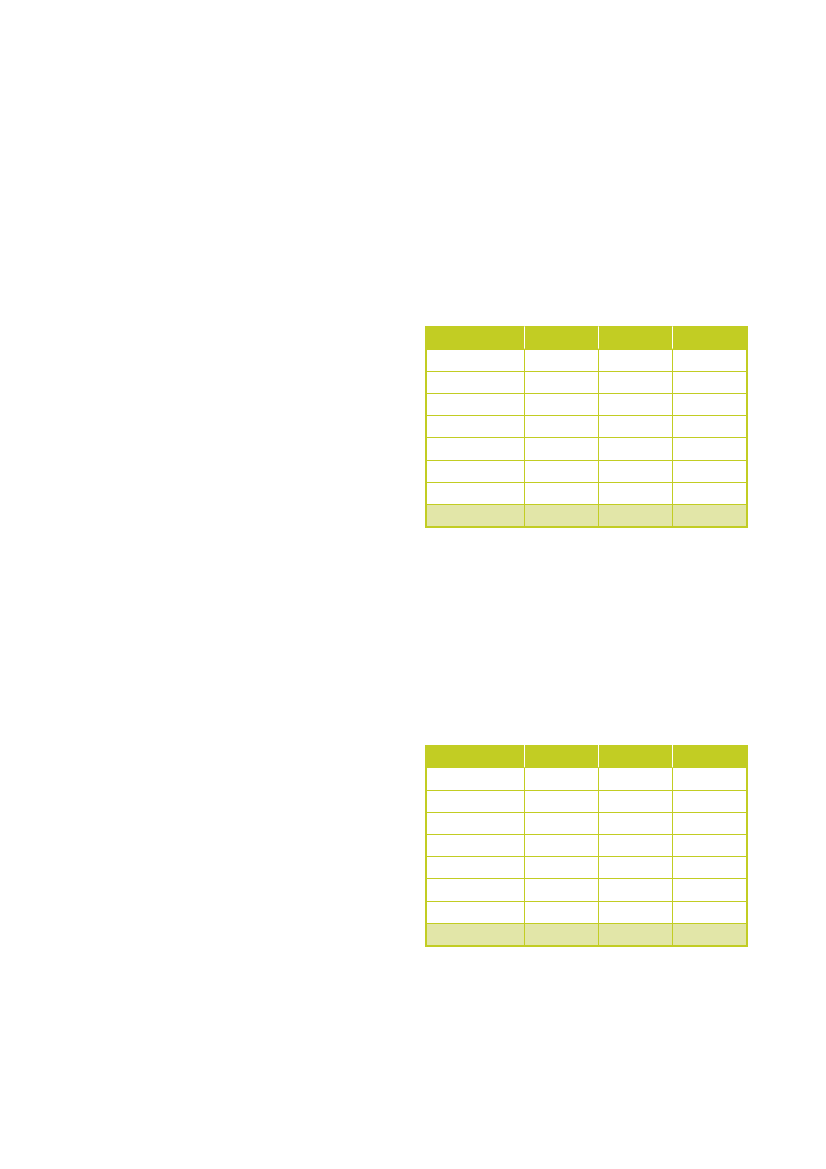
Table 2.1: Percentage of organisations having an5environmental management systemCentralAustriaDenmarkFinlandGermanyThe NetherlandsSwedenUnited Kingdom35%30%29%8%29%75%50%36%Non-central9%26%27%9%21%33%32%22%Total10%26%27%9%22%38%33%24%
2.1
Summary
Within the majority of organisations, the procurementpolicy contains a section on the environmental aspects ofprocurement. Responsibility for realizing ambitions ongreen procurement is mostly in the hands of the middlemanagement (for instance head of the procurement unit)or a higher level.Furthermore, to keep the level of knowledge andinformation up to date, respondents nameintergovernmental cooperation and seminars as the mostimportant sources. In addition, organisations use countryspecific sources, mostly reachable through the internet. Asubstantial part of the respondents (16 % on average)use the GPP website of the European Commission as anadditional source.Finally, this study shows that methods for Life CycleCosting (LCC) are not yet fully incorporated into theprocurement process. Organisations evaluate proposalsmore often on purchasing costs than on the outcome ofLCC. Decisive arguments for choosing ‘green’ during the
The table above shows the percentage of organisationsthat have implemented an environmental managementsystem (EMS). On average, less than a quarter of theorganisations has an EMS. Within most countries,percentages are higher for central government. Swedenranks highest among the seven countries.
2.3
Procurement policy
Table 2.2: Percentage of organisations having anenvironmental component to their procurement policyCentralAustriaDenmarkFinlandGermanyThe NetherlandsSwedenUnited Kingdom87%89%35%42%55%62%100%67%Non-central61%90%34%73%69%87%89%72%Total61%90%34%72%67%84%89%71%
5
The percentages equal the number of ‘yes’-answers as part of the total number of respondents. Percentages at the bottom of the table are thearithmetic means over all seven member states.
Collection of statistical information on Green Public Procurement in the EU
19
Within the majority of organisations, the procurementpolicy contains a section on the environmental aspects ofprocurement. Finland is an exception to this general rule.
Table 2.4: Percentage of organisations for which greenprocurement is part of the regular Planning & Control cycleCentralAustria53%39%31%17%26%37%100%43%Non-central14%41%34%12%21%38%49%30%Total15%41%34%12%21%38%52%31%
2.4
Implementation of Green PublicProcurementTasks and responsibilities
DenmarkFinlandGermanyThe Netherlands
2.4.1
Table 2.3: Percentage of organisations having an action planfor meeting goals on green procurementCentralAustriaDenmarkFinlandGermanyThe NetherlandsSwedenUnited Kingdom40%28%21%23%40%27%100%40%Non-central11%38%16%20%30%38%58%30%Total12%37%16%20%31%37%61%31%
SwedenUnited Kingdom
green procurement being part of the Planning & Controlcycle means that green procurement has been put intothe (financial) processes within the organisation. It is anindication that GPP is taken seriously. The results in thetable above show a picture which is similar to theprevious table. Again, UK organisations rank highest.When being asked who is responsible for realizingambitions on green procurement, most organisationsreply ‘middle management’ (for instance head of theprocurement unit) or a higher level. Relatively largedifferences can be seen between countries.
This question draws a divergent picture. The majority ofthe governmental organisations from the UK have anaction plan for meeting goals on green procurement.Other countries rank lower.
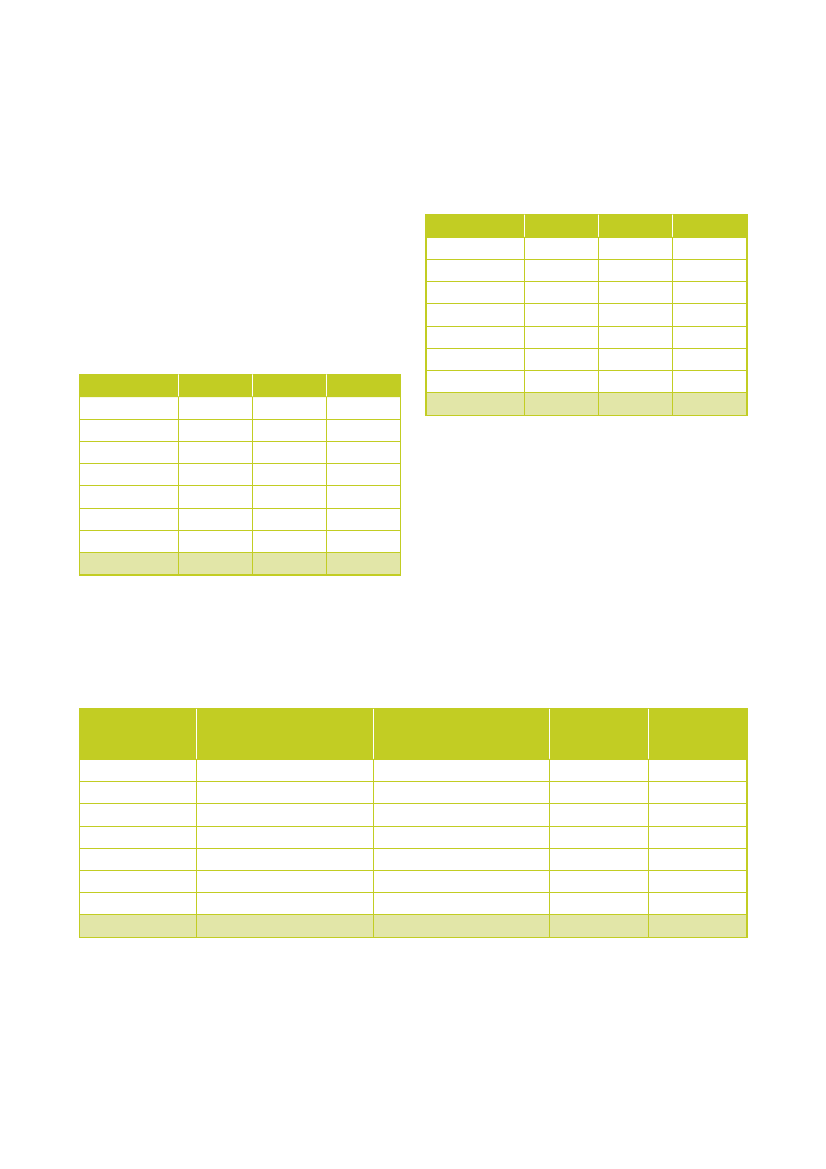
Table 2.5: Responsible level for meeting goals set for making procurement more sustainable (% of organisations)TotalManagement / directorate oforganisation (e.g. minister,municipal executive)49%7%19%36%22%20%10%23%Middle management (e.g.procurement coordinator,procurement department)23%77%41%8%32%46%66%42%ProcurersOther / unknown
AustriaDenmarkFinlandGermanyThe NetherlandsSwedenUnited Kingdom
9%0%18%24%10%25%7%13%
18%17%22%32%36%9%18%22%
20
PricewaterhouseCoopers
2.4.2
Empowerment and sources of information
Table 2.6: Measures taken to empower the responsible people to meet the green procurement goals (multiple optionspossible)TotalTraining andeducation ofprocurement officersin the field of greenprocurementActivecommunicationtowards theorganisation aboutset goals in makingprocurement moresustainable22%32%15%21%35%22%49%28%Formally appointedpowers to theresponsible officersPolitical supportOther (incl. ‘nothinghas been done’)
AustriaDenmarkFinlandGermanyThe NetherlandsSwedenUnited Kingdom
9%28%17%9%24%39%57%26%
24%14%12%25%15%13%9%16%
6%17%2%6%12%16%24%12%
12%10%15%4%28%16%13%14%
To support the responsible people in meeting the organisational goals on green procurement, several measures havebeen taken. Training and education, and active communication are mentioned most frequently by the respondents,especially by UK governmental organisations. In most cases, political support for the responsible people is low.Table 2.7: External sources being used to find information about green procurement (multiple options possible)TotalEuropeanCommission GPPwebsite9%24%18%18%9%14%22%16%Procura+ websiteEcolabelCountry specificsources5%33%4%5%15%38%24%18%21%72%16%33%78%67%67%51%Other
AustriaDenmarkFinlandGermanyThe NetherlandsSwedenUnited Kingdom
4%2%7%4%4%33%14%10%
23%30%15%8%19%17%40%22%
For green procurement information, most organisations rely on country specific sources, mostly reachable through theinternet. This applies in particular to Denmark and the Netherlands. A substantial part of the respondents use the GPPwebsite of the European Commission as an additional source.
Collection of statistical information on Green Public Procurement in the EU
21
Table 2.8: Most frequently consulted country specific sources (% of organisations)TotalAustriaDenmarkFinlandGermanyThe NetherlandsSwedenUnited KingdomExternal sourceTake it! (www.oekoweb.at/takeit)Staten og KommunernesIndkøbscentralSyke (Finnish EnvironmentInstitute)Website Blauer EngelMilieukeurNordiska ministerrådetDEFRA (Department forEnvironment, Food and RuralAffairs)11%55%16%33%20%4%48%External sourceCheck it!(www.ifz.tugraz.at/oekoeinkauf)Miljøvejledninger (Miljøstyrelsen)HymonetWebsite des Umweltbundesamts(beschaffung-info.de)SenterNovemMiljöstyrningsrådetOGC Buying Solutions21%69%13%33%78%67%67%
The table above shows which country specific sources are consulted. SenterNovem (Dutch agency on sustainabilityand innovation) has been consulted most frequently. Other popular sources include the Office of GovernmentCommerce from the UK, the Swedish Miljöstyrningsrådet (Environmental Management Council) and Miljøvejledninger(Ministry of the Environment) from Denmark.Table 2.9: Means to keep the level of knowledge and information on green procurement up to date (multiple options possible)TotalTraining andeducation11%9%27%12%19%34%50%23%SeminarsBy cooperating withother (governmental)organisations13%37%21%7%42%56%49%32%21%54%27%25%40%40%42%36%InternetOther (incl. ‘nothinghas been done’)9%42%18%19%52%32%29%29%14%18%11%7%15%6%10%12%
AustriaDenmarkFinlandGermanyThe NetherlandsSwedenUnited Kingdom
To keep knowledge and information up to date, again internet sources are being used frequently by sustainableprocurers. But even more frequently, respondents mention ‘cooperation’ and ‘seminars’ as important sources to stayup to date. Training and education seem to be slightly less important.
22
PricewaterhouseCoopers
In the table below, we list the internet sources most frequently used by the respondents (open question). By far themost frequently mentioned sources are www.senternovem.nl (Dutch) and www.msr.se (Swedish). This is in agreementwith the question on the external sources being used.Table 2.10: Internet sources most frequently used (% of organisations)TotalAustriaDenmarkFinlandGermanyThe NetherlandsSwedenUnited Kingdomwww.oekokauf.wien.atwww.elsparefonden.dkwww.hymonet.comwww.umweltbundesamt.dewww.senternovem.nlwww.msr.sewww.ogc.gov.ukInternet source most frequently usedwww.ifz.tugraz.atwww.mst.dkwww.ymparisto.fiwww.beschaffung-info.dewww.pianoo.nlwww.avropa.nuwww.defra.gov.uk/sustainable/government/www.bbg.gv.atwww.ecolabel.dkwww.hansel.fiwww.iclei.orgsuppliers websitessuppliers websiteswww.eauc.org.uk
2.4.3
Procurement process
Table 2.11: Percentage of organisations comparing environmental aspects compared with price and other criteria during theprocurement processTotalAustriaDenmarkFinlandGermanyThe NetherlandsSwedenUnited KingdomYes, always5%17%7%17%14%3%25%13%Yes, most of thetime39%41%17%29%34%33%28%31%Yes, sometimes34%37%30%38%36%43%35%36%Seldom16%6%40%14%13%18%6%16%Never6%0%6%2%4%3%6%4%
In general, governmental organisations take environmental aspects into account within part of their tender processes(‘sometimes’ or ‘most of the time’). Within the UK and Denmark, the environmental aspects are most frequently part ofthe award process, within Finland least frequently.
Collection of statistical information on Green Public Procurement in the EU
23
Table 2.12: Percentage of organisations evaluating proposals on Life Cycle Costing or on the procurement costs of theproduct/service onlyTotalMostly evaluation on LCCSometimes evaluation on LCC,sometimes evaluation onpurchasing costs46%57%38%49%40%30%58%45%Mostly evaluation onpurchasing costs45%31%48%37%49%62%16%41%
AustriaDenmarkFinlandGermanyThe NetherlandsSwedenUnited Kingdom
9%12%14%14%11%7%26%13%
In an LCC analysis, various cost elements in the user life cycle of a product are taken into account. This means that notonly purchase prices are analyzed, but also other cost elements for the user, depending on the nature of the product orproduct group. From the table above, it appears that methods for LCC are not yet fully incorporated into theprocurement process. Organisations evaluate proposals more often on purchasing costs than based on the outcome ofLCC (see, for instance, the Netherlands and Finland). Again, the UK is an exception to this general rule. Within thiscountry, evaluation on LCC occurs more frequently than on purchasing costs only.Table 2.13: Decisive criteria for asking for “green” goods by including green criteria as minimum technical specifications or asaward criteria (multiple options possible)TotalVolume ofthe tender,only thelargertendersVolume ofthe tender,only thesmallertendersEnvironmen Availability Familiaritywith greenof greental impactalternatives alternativesof thepurchaseFamiliaritywithsuppliersthat offergreengoods/services18%31%14%11%23%21%15%19%The impact of thegreen alternative onthe processes of theorganisation - onlychoosing for thegreen alternativewhen impact isminimal9%3%3%10%19%6%9%8%Other
AustriaDenmarkFinlandGermanyThe NetherlandsSwedenUnited Kingdom
7%17%4%5%8%2%11%8%
2%5%1%2%1%2%4%2%
19%48%36%25%44%54%50%40%
45%41%29%29%53%57%45%43%
22%38%28%20%41%39%18%29%
7%11%8%3%13%6%4%7%
Finally, we asked the respondents which considerations are decisive for choosing ‘green’ during the procurementprocess. Most decisive are the environmental impact of the purchase, and the availability of and the familiarity withgreen alternatives. The volume of the tender and the impact on the organisation are considered least important by therespondents.
24
PricewaterhouseCoopers
3Green Public
Procurement percountry
This chapter reports on the main results ofindicators 1 and 2. First, the results will bepresented on an aggregated level over the sevenparticipating countries. In paragraph 3.2 andfurther the results will be presented brokendown per country and product group. AppendixD gives information on the results of scores percountry broken down by central anddecentralised government organisations.
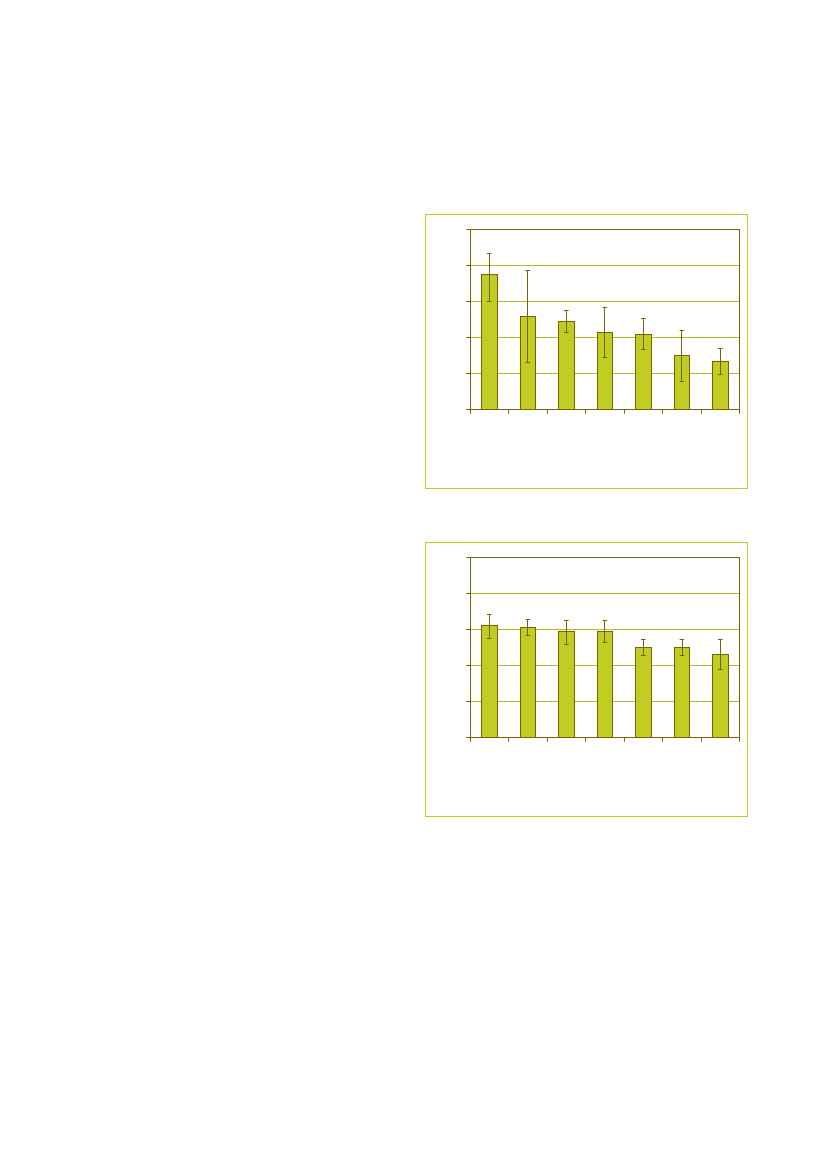
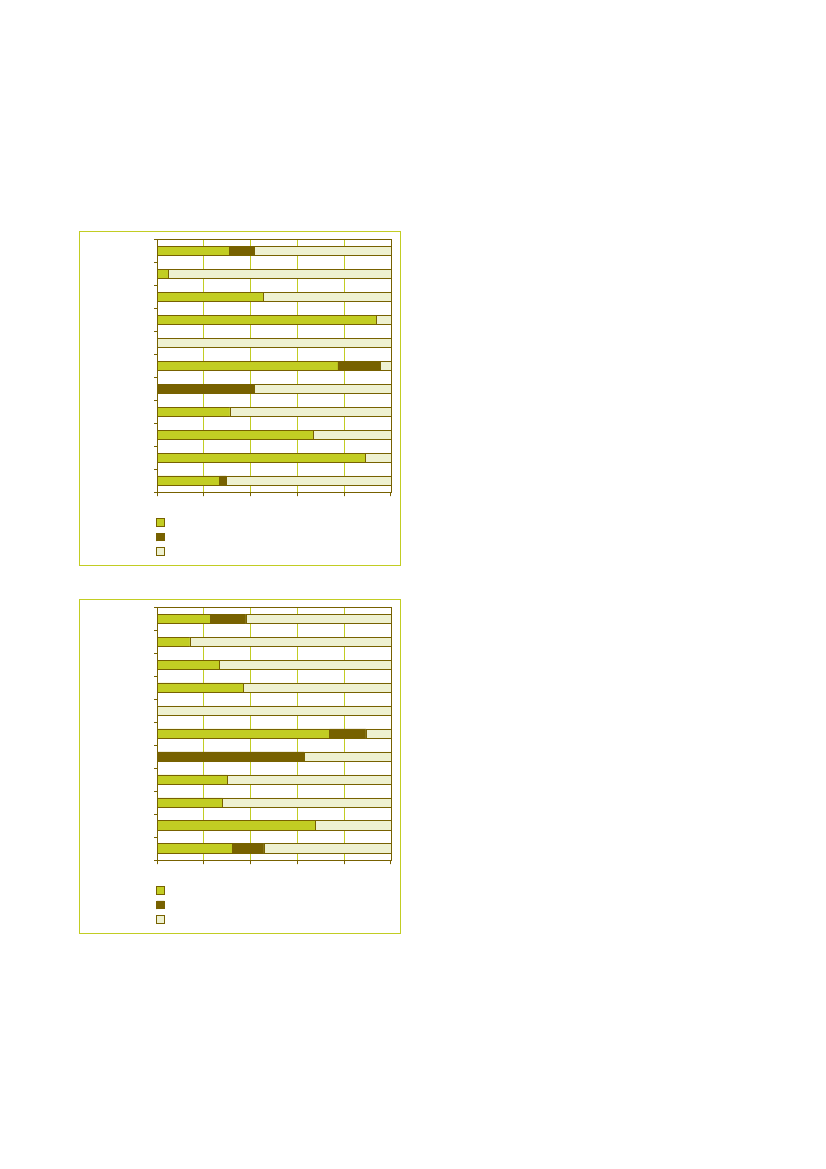
Figure 3.1: Overall scores on indicator 1. The precision levelsare indicated by the length of the uncertainty bars.100%80%60%40%20%0%
Almost all figures in this chapter show a core level ofGPP, a comprehensive level of GPP and a non-greenlevel of GPP per country or per product group. A corelevel of GPP represents the percentage of GPP meetingcore criteria only. The comprehensive level of GPPrepresents the percentage of procurement value ornumber of contracts meeting core criteria as well ascomprehensive criteria. The total percentage of greenprocurement is calculated by adding the percentage corelevel of GPP to the percentage of comprehensive level ofGPP.
UnitedKingdom
Sweden
Finland
Figure 3.2: Overall scores on indicator 2. The precision levelsare indicated by the length of the uncertainty bars.100%
3.1
Summary
80%60%40%20%0%
UnitedKingdom
Netherlands
Collection of statistical information on Green Public Procurement in the EU
Germany27
Denmark
The four figures below show the total amount of GPP percountry expressed as a percentage of the totalprocurement value and as a percentage of the totalamount of contracts per country. In the first two figures,we have indicated the levels of GPP of green purchases(i.e. core plus comprehensive), as well as the precisionlevels indicated by the length of the uncertainty bars. Inthe subsequent two figures, we have broken down thelevels of GPP into core levels and comprehensive levels.Also, the averages of the Green-7 are shown in thesefigures.
Sweden
Finland
Austria
Netherlands
Austria
Germany
Denmark
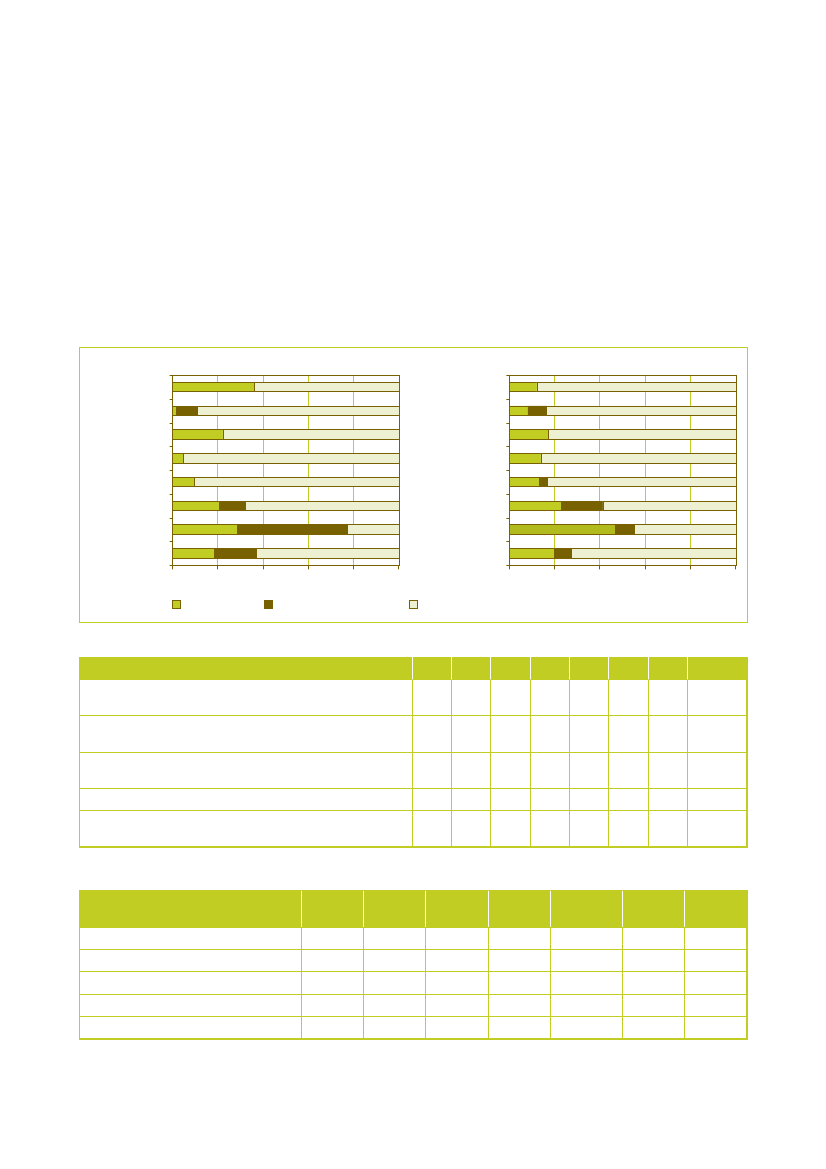
Figure 3.3: Overall scores on indicator 1, broken down bycore and comprehensive levels of GPP. Also the average ofthe Green-7 is shown.United KingdomAustriaSwedenFinlandDenmarkGermanyNetherlandsGreen-7 average0%20%40%60%80% 100%
For indicator 2 the overall results show a score of 55%green level of GPP when expressed as a percentage ofthe total amount of contracts, of which is 39% core levelof GPP and 16% comprehensive level of GPP.Concerning the precision levels, we see that for indicator2, all countries have very low uncertainties, while forindicator 1 the uncertainties are much higher. This is aresult of the weighing of product groups on the basis ofprocurement value (indicator 1), which increases thespreading of the data and henceforth the precision level.In Austria, this has even led to high levels of uncertaintyfor indicator, which results in less reliability of the data.Further, we see that in the Netherlands, Sweden andFinland, the uncertainties for indicator 1 are quite low dueto the high response rates in these countries.What is also striking is that indicator 1 shows a differentranking of the seven countries compared to indicator 2.For indicator 1 the United Kingdom is the best performingcountry whereas indicator 2 shows Austria to be the bestperforming country. The difference between the highestscoring country and the lowest scoring country is biggerfor indicator 1 than for indicator 2. Indicator 1 showsUnited Kingdom as the highest scoring country (75%green purchases of total procurement value) and theNetherlands as the lowest scoring country (27% greenpurchases of total procurement value). Indicator 2 showsAustria as the highest scoring country (62% greenpurchases of total number of contracts) and Germany asthe lowest scoring country (46% green purchases of totalnumber of contracts).In the textbox on page 36 a specific case illustrates howthe results of indicator 1 and 2 should be interpreted andhow the differences between the two indicatorscomplement each other. In the following sections, we willpresent results of the levels of GPP at country level.
Core greenComprehensive greenNon green
Figure 3.4: Overall scores on indicator 2, broken down bycore and comprehensive levels of GPP. Also the average ofthe Green-7 is shown.AustriaSwedenUnited KingdomDenmarkNetherlandsFinlandGermanyGreen-7 average0%20%40%60%80% 100%
Core greenComprehensive greenNon green
These four figures show a number of striking results. Firstof all, figures 3.3 and 3.4 show that the level of GPP inthese seven countries shows an average overall level of45% green level of GPP when expressed as a percentageof the procurement value of which is 31% core level and14% comprehensive level of GPP. This means that 55%of the procurement value in the seven participatingcountries has been procured non-green.
28
PricewaterhouseCoopers
3.2
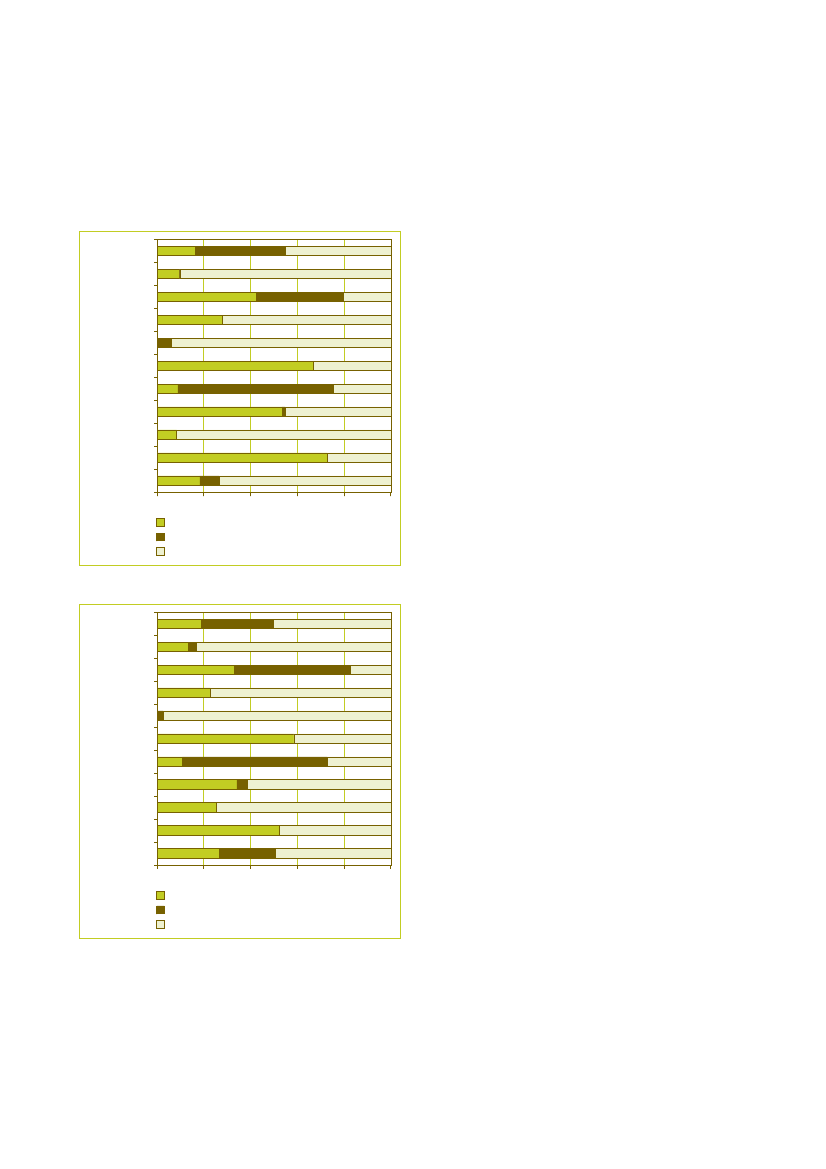
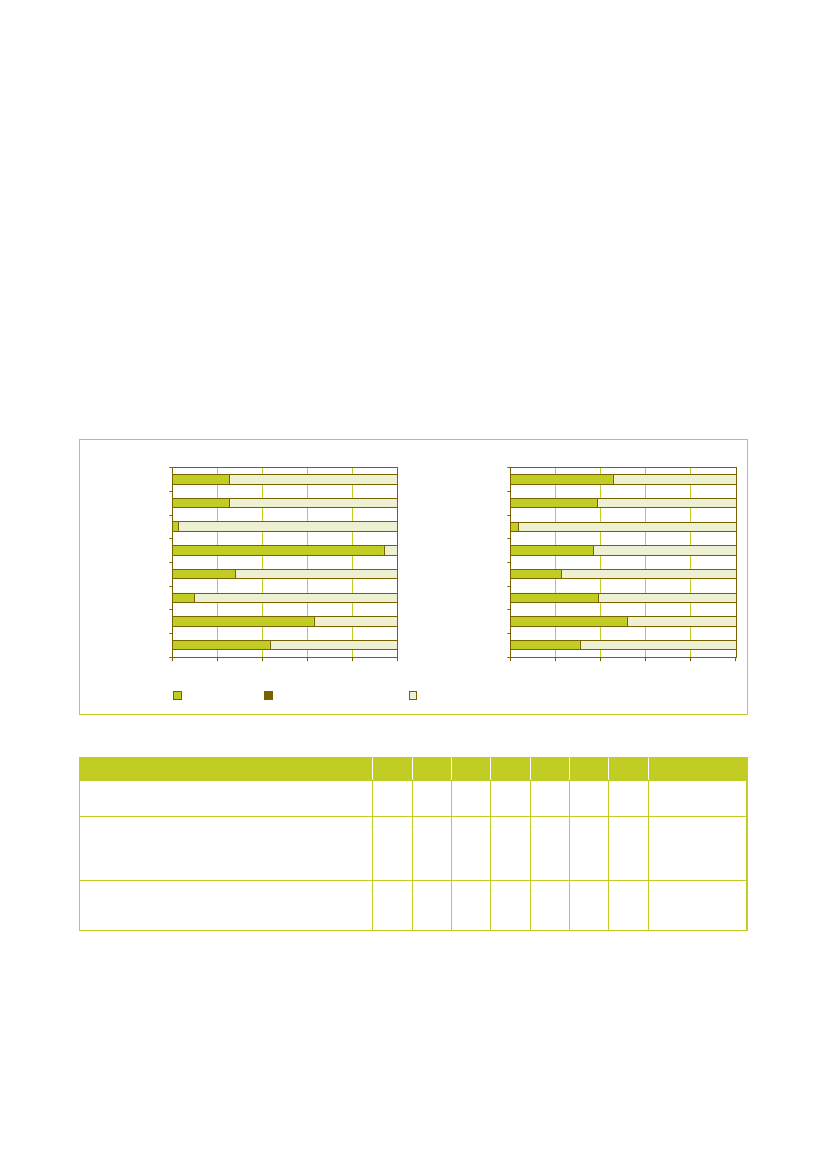
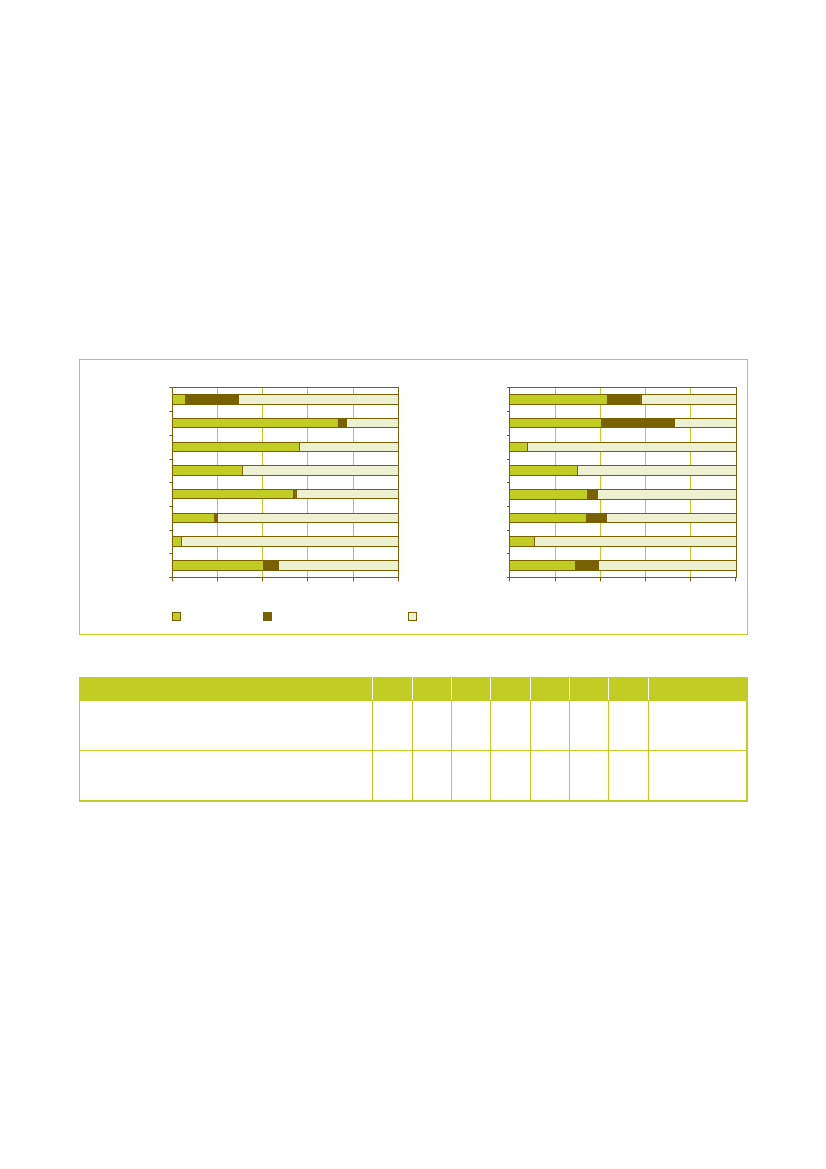
AustriaAustria’s average results for indicator 1 show 52% ofgreen purchasing, which is divided in 49% core level ofGPP and 3% comprehensive level of GPP. Hence 48% ofthe purchasing can be considered as having a non-greenlevel of GPP. The average results for indicator 2 are 62%green purchasing (47% core level of GPP and 15%comprehensive level of GPP) and 38% non-green level ofGPP.The levels of GPP for indicator 1 and 2 for Austria show anumber of interesting results. Austria scores very well onseveral product groups. 98% of the procurement value ofelectricity has been spent on core or comprehensivegreen. When expressed in indicator 2, 53% of thenumber of tenders for electricity in Austria can beconsidered as comprehensive green. For the productgroup gardening, Austria scores for indicator 1 as well asfor indicator 2 100% non-green. The results might beskewed by the relatively low response on this productgroup in Austria. A few responses then heavily influencethe final scores for a product group.Another remarkable result is Austria’s score for theproduct group paper. Austria scores a 100% green levelof GPP for indicator 1 on paper, of which 88% iscomprehensive green.A last interesting result is that Austria scores 100% greenlevel of GPP on furniture for indicator 1 and 95% greenlevel of GPP for indicator 2. One contract contributes 5%to Austria’s score for indicator 2. That specific contractonly has a small procurement value. Therefore the valueof this contract completely disappears when comparedwith the total procurement value for this product group.
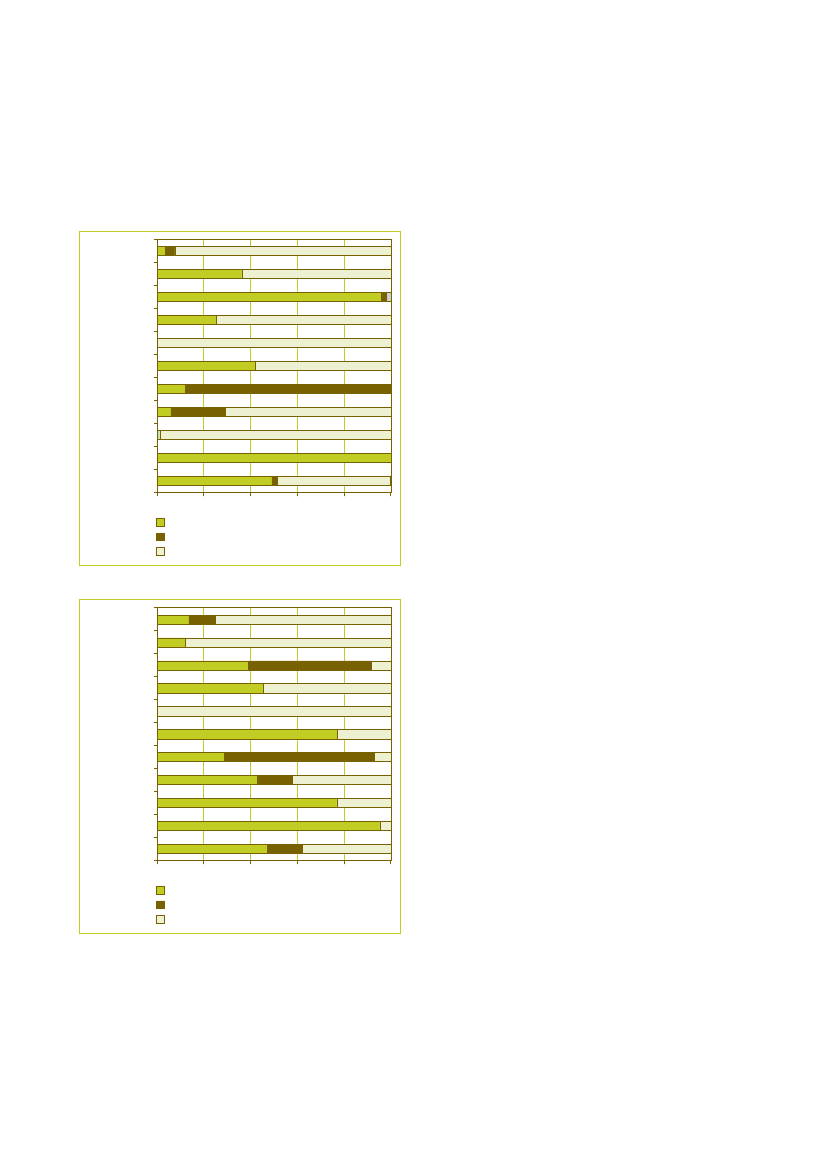
Figure 3.5: Overall scores Austria on indicator 1CleaningConstructionElectricityCateringGardeningOffice ITPaperClothingTransportFurnitureAverage0%20%40%60%80% 100%
Core greenComprehensive greenNon green
Figure 3.6: Overall scores Austria on indicator 2CleaningConstructionElectricityCateringGardeningOffice ITPaperClothingTransportFurnitureAverage0%20%40%60%80% 100%
Core greenComprehensive greenNon green
* Austria’s results for clothing might be skewed because of lowresponse
Collection of statistical information on Green Public Procurement in the EU
29
3.3
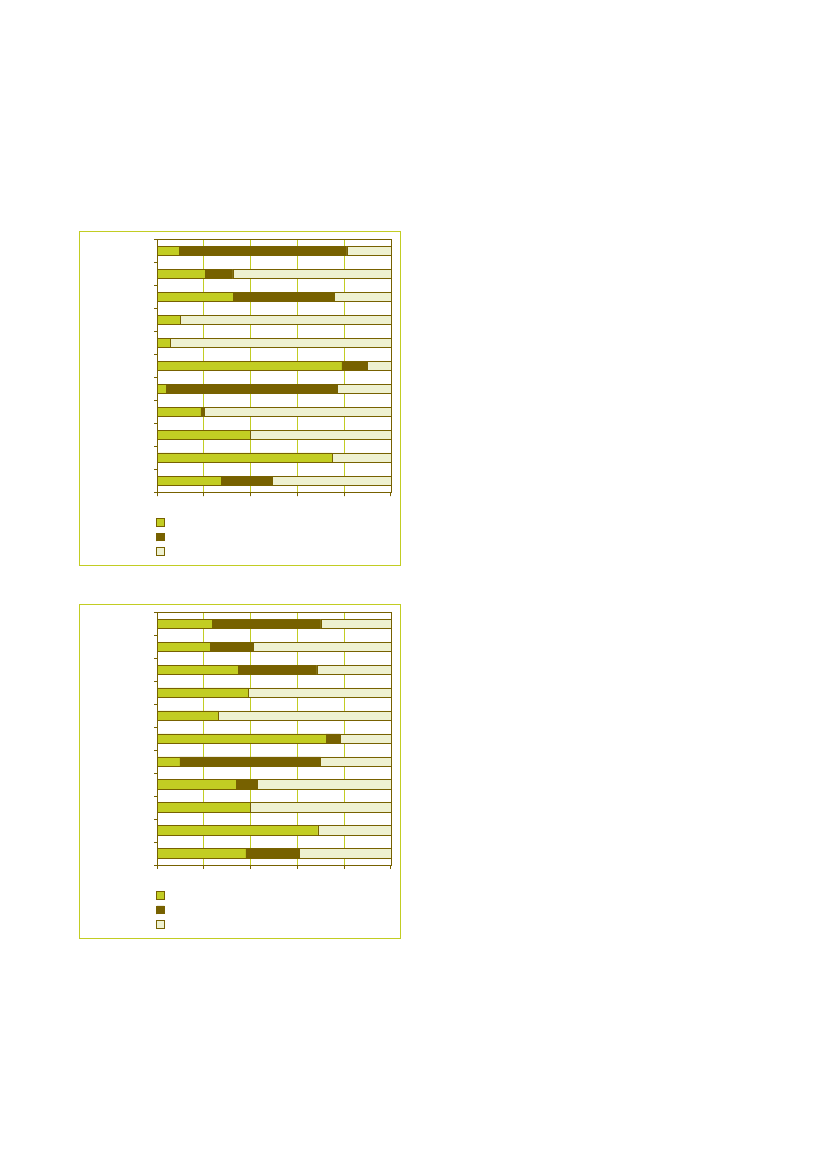
DenmarkDenmark’s average results for indicator 1 show 42 % ofgreen purchasing (30% core level and 12%comprehensive level of GPP) and 58% non-green level ofGPP. The average results for indicator 2 are 46% corelevel of GPP, 13% comprehensive level, which sums to atotal of 59% of green purchasing. Hence 41% of theprocurement in Denmark can be considered asnon-green.The results of Denmark for indicator 1 and 2 show a greatvariety in scores for the ten product groups. On theproduct group cleaning Denmark scores 93% green forindicator 1, while for product group office IT Denmarkscores 86% green level of GPP. On the other hand thereare low scores on construction (11% green for indicator1), catering (25% green on indicator 1) and transport(10% green for indicator 1).0%20%40%60%80% 100%
Figure 3.7: Overall scores Denmark on indicator 1CleaningConstructionElectricityCateringGardeningOffice ITPaperClothingTransportFurnitureAverage
Core greenComprehensive greenNon green
Figure 3.8: Overall scores Denmark on indicator 2CleaningConstructionElectricityCateringGardeningOffice ITPaperClothingTransportFurnitureAverage0%20%40%60%80% 100%
The difference between indicator 1 and 2 is shown againby the scores for product groups gardening (92 % corelevel for indicator 1 and 40% core level for indicator 2),paper (91% comprehensive level for indicator 1 and 32%comprehensive level for indicator 2) and clothing (73%core level for indicator 1 and 40% core level for indicator2).
Core greenComprehensive greenNon green
* Denmark’s results for gardening might be skewed because oflow response
30
PricewaterhouseCoopers
3.4
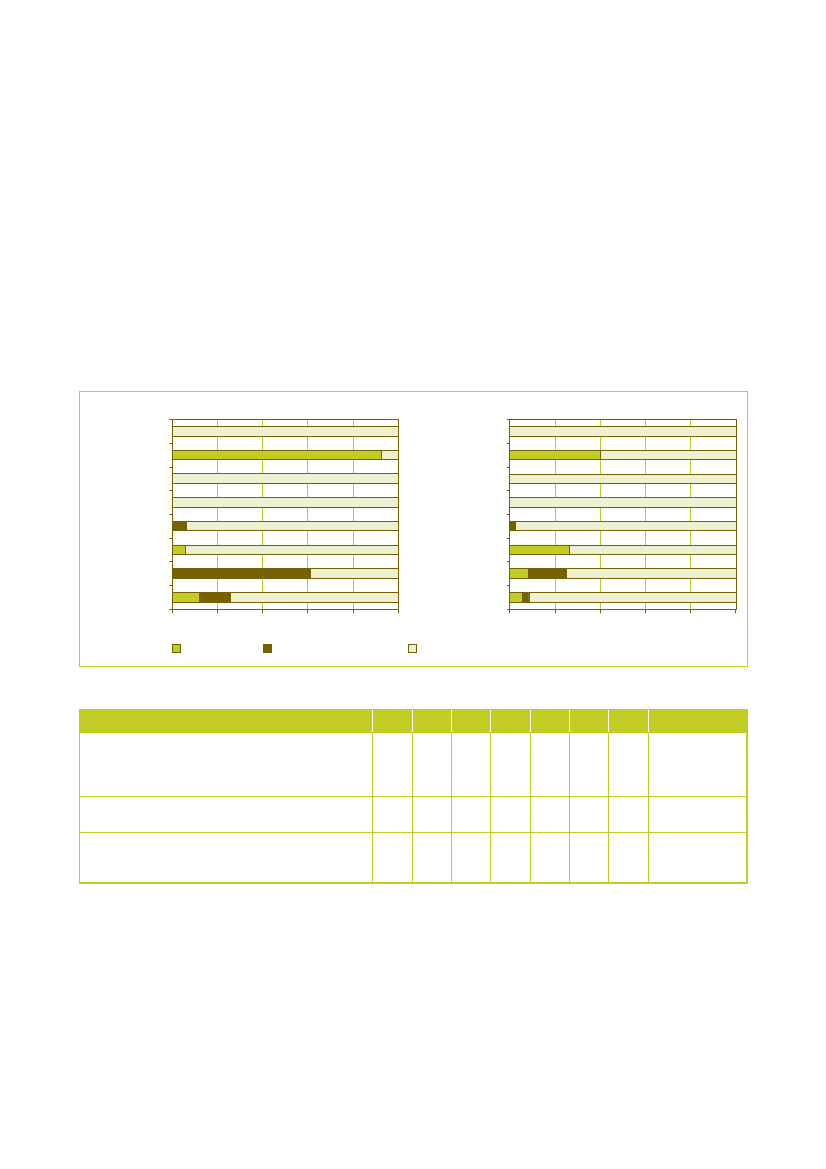
FinlandFinland’s average results for indicator 1 show 43% greenpurchasing, which is divided in 35% core level of GPPand 8% comprehensive level of GPP. The average resultsfor indicator 2 are 39% core level of GPP, 11%comprehensive level of GPP (total green purchases are50%) and 50% non-green level of GPP.The results of Finland show high scores on the productgroups cleaning, office IT and furniture. 66% of the totalamount of contracts for cleaning is comprehensive level(indicator 1). 78% of the contracts for office IT are oncore level of GPP (indicator 2).There are also a couple of product groups that show lowscores of GPP: catering (4% core level for indicator 2),gardening (0% green for indicator 2) and clothing (8%core level on indicator 2).
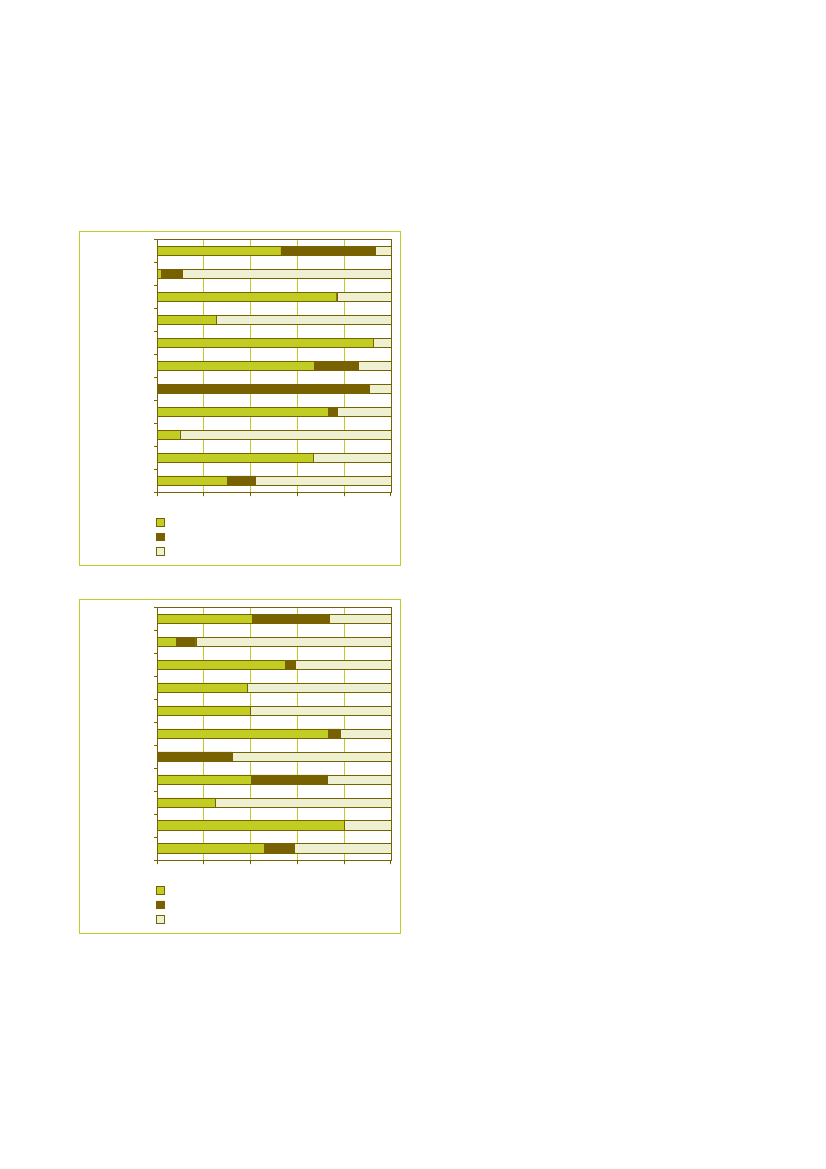
Figure 3.9: Overall scores Finland on indicator 1CleaningConstructionElectricityCateringGardeningOffice ITPaperClothingTransportFurnitureAverage0%20%40%60%80% 100%
Core greenComprehensive greenNon green
Figure 3.10: Overall scores Finland on indicator 2CleaningConstructionElectricityCateringGardeningOffice ITPaperClothingTransportFurnitureAverage0%20%40%60%80% 100%
Core greenComprehensive greenNon green
Collection of statistical information on Green Public Procurement in the EU
31
3.5
GermanyGermany’s average results for indicator 1 show 30% ofgreen purchasing (27% core level of GPP and 3%comprehensive level of GPP) and 70% non-green level ofGPP. The average results for indicator 2 are that 46% ofthe contracts can be considered as green (32% corelevel of GPP and 14% comprehensive level of GPP) and54% can be considered as having a non-green level ofGPP.The results of Germany show a high level of GPP foroffice IT (96% green for indicator 1) and furniture (89%core level for indicator 1). The results show an average orlower score of GPP for the product groups construction(5% core level on indicator 1), gardening (0% green onindicator 1) and clothing (31% core level on indicator 1).Germany’s results for catering show again howmeasuring levels of GPP by procurement value leads todifferent results compared to measuring by the number ofcontracts. Germany scores 94% core level for indicator 1and 37% for indicator 2.
Figure 3.11: Overall scores Germany on indicator 1CleaningConstructionElectricityCateringGardeningOffice ITPaperClothingTransportFurnitureAverage0%20%40%60%80% 100%
Core greenComprehensive greenNon green
Figure 3.12: Overall scores Germany on indicator 2CleaningConstructionElectricityCateringGardeningOffice ITPaperClothingTransportFurnitureAverage0%20%40%60%80% 100%
Core greenComprehensive greenNon green
* Germany’s results for construction and gardening might beskewed because of low response
32
PricewaterhouseCoopers
3.6
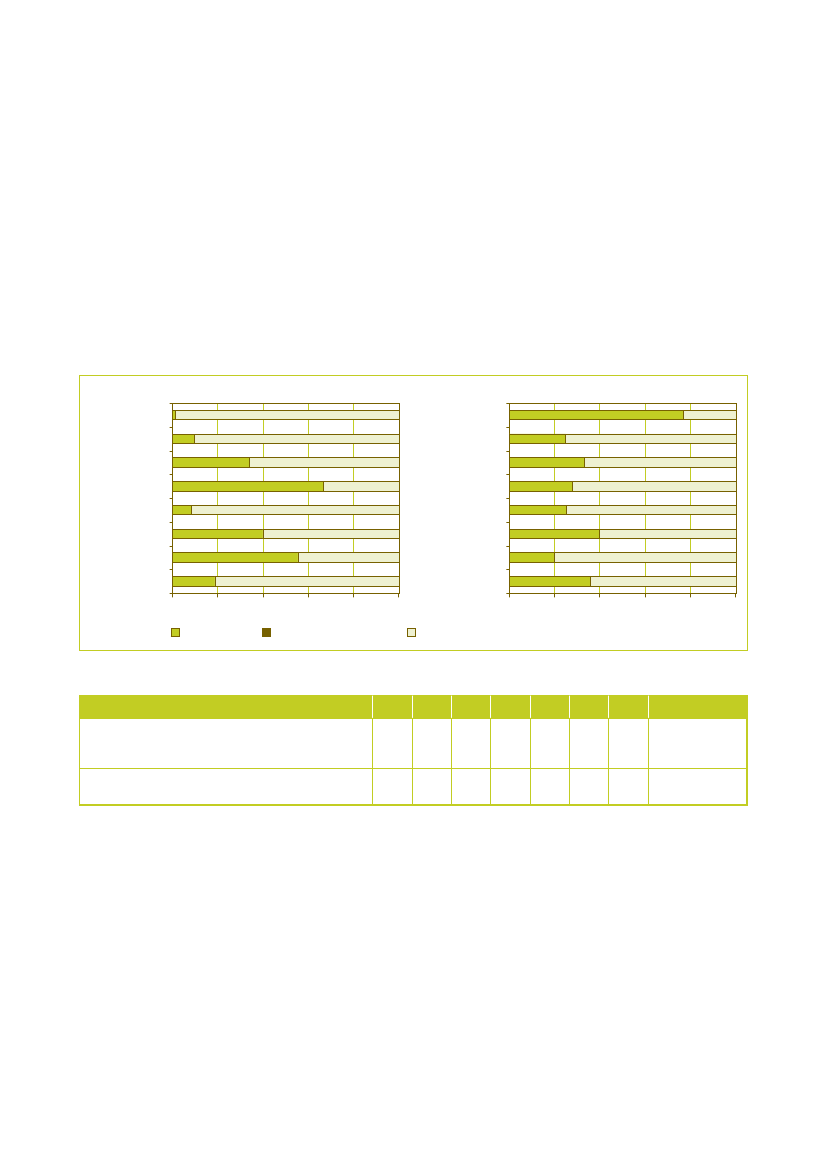
The NetherlandsThe average results of the Netherlands for indicator 1show 18% core level of GPP and 8% comprehensivelevel of GPP which results in a total percentage of greenprocurement of 27%. The average results for indicator 2are 50% green purchasing (27% core level of GPP and24% comprehensive level of GPP) and thus also 50% ofnon-green purchases.The results of the Netherlands show a number of highscores on the comprehensive levels of GPP: 39% forcleaning (indicator 1), 50% for electricity (indicator 2),66% for paper (indicator 1). There are also some Dutchresults that show average or low scores: 10% core levelGPP for construction (indicator 1), 23% core level GPPfor catering (indicator 2), 3% comprehensive level GPPon gardening (indicator 2) and 8% core level GPP fortransport (indicator 1).0%20%40%60%80% 100%
Figure 3.13: Overall scores The Netherlands on indicator 1CleaningConstructionElectricityCateringGardeningOffice ITPaperClothingTransportFurnitureAverage
Core greenComprehensive greenNon green
Figure 3.14: Overall scores The Netherlands on indicator 2CleaningConstructionElectricityCateringGardeningOffice ITPaperClothingTransportFurnitureAverage0%20%40%60%80% 100%
Core greenComprehensive greenNon green
Collection of statistical information on Green Public Procurement in the EU
33
3.7
SwedenSweden’s average results for indicator 1 show 28% corelevel of GPP and 22% comprehensive level of GPP whichsums up to 49% of green purchases. Hence, 51% of theprocurement value can be considered as beingnon-green. The average results for indicator 2 are 61%green contracts (38% core level of GPP and 23%comprehensive level of GPP) and 39% non-greencontracts.Sweden’s results show a couple of high scores: cleaning(81% green level of GPP for indicator 1), electricity (76%green level of GPP for indicator 1), office IT (90% greenlevel of GPP for indicator 1), paper (77% green level ofGPP for indicator 1) and furniture (75% green level ofGPP for indicator 1).Sweden’s results show significantly lower scores for theproduct groups construction (33% green level of GPP forindicator 1), catering (10% green level of GPP forindicator 1), gardening (6% green level of GPP forindicator 1) and clothing (20% green level of GPP forindicator 1).
Figure 3.15: Overall scores Sweden on indicator 1CleaningConstructionElectricityCateringGardeningOffice ITPaperClothingTransportFurnitureAverage0%20%40%60%80% 100%
Core greenComprehensive greenNon green
Figure 3.16: Overall scores Sweden on indicator 2CleaningConstructionElectricityCateringGardeningOffice ITPaperClothingTransportFurnitureAverage0%20%40%60%80% 100%
Core greenComprehensive greenNon green
34
PricewaterhouseCoopers
3.8
United KingdomUnited Kingdom’s average results for indicator 1 showtotal green purchases of 75% (33% core level of GPPand 41% comprehensive level of GPP) and 25% ofnon-green purchases. The average results for indicator 2are 47% core level of GPP and 12% comprehensive levelof GPP, which sums up to 59% green contracts. Hence41% of the contracts can be considered as beingnon-green.The results of the United Kingdom vary widely on thedifferent product groups. In six out of ten product groupsthe green level of GPP for indicator 1 (core andcomprehensive level combined) exceeds 60% green levelof GPP (from 61% for gardening and 63% for catering to77% for construction and 100% for furniture). The otherfour product groups score from as high as 59% onelectricity to as low as 4% on clothing.0%20%40%60%80% 100%
Figure 3.17: Overall scores United Kingdom on indicator 1CleaningConstructionElectricityCateringGardeningOffice ITPaperClothingTransportFurnitureAverage
Core greenComprehensive greenNon green
Figure 3.18: Overall scores United Kingdom on indicator 2CleaningConstructionElectricityCateringGardeningOffice ITPaperClothingTransportFurnitureAverage0%20%40%60%80% 100%
Core greenComprehensive greenNon green
Collection of statistical information on Green Public Procurement in the EU
35
Concerning construction in the UK, there are twointeresting observations: (1) the level of GPP forconstruction is high compared to other countries and(2) the level of GPP differs a lot between indicator 1and indicator 2. This behaviour is the result of the factthat one respondent in the UK indicated to have spenta huge amount of money on construction, usingcomprehensive criteria. The figures have been verifiedwith the organisation, which turned out to haveembarked a major capital rebuild programme. As aresult of the new buildings in the year of our study, theorganisation spent an substantial amount of money onvarious construction projects.This case is a good example of the differencebetween indicator 1 (based on procurement value)and indicator 2 (based on the number of contracts).From an environmental point of view, indicator 1makes most sense: a huge building project naturallyhas a huge environmental impact. Therefore, if greencriteria are applied, this should be reflected in theoverall figures. On the other hand, because of this oneproject, it might seem that the UK is already verymuch ahead concerning GPP, while this may only bebased on 1 organisation distorting the figure. For thisreason, indicator 2 is necessary as a complementaryindicator.In conclusion, both indicators are equally important toindicate the level of GPP in a certain country. Indicator1 is more relevant from an environmental point ofview, while indicator 2 is more appropriate when oneis interested in the general implementation of GPP in acountry (the change in mentality of public purchasers).
36
PricewaterhouseCoopers
4Green Public
Procurement perproduct group
Chapter 3 presented an overall picture of thequantitative levels of Green Public Procurementper country. The current chapter provides somemore detailed information per product group.For each product group, we compare the resultsof the seven Member States (indicators 1 and 2).Furthermore, we report how often (%)respondents said to have used a certain greencriterion in their procurement contracts. Thesecriteria are linked to a core or comprehensivelevel of GPP. A respondent complying with allcore criteria within a product group is said tohave a core level of GPP. If, in addition, therespondent complies with the comprehensivecriteria, he or she attains a comprehensive levelof GPP. This chapter shows to what extent therespondents comply with the green criteria.
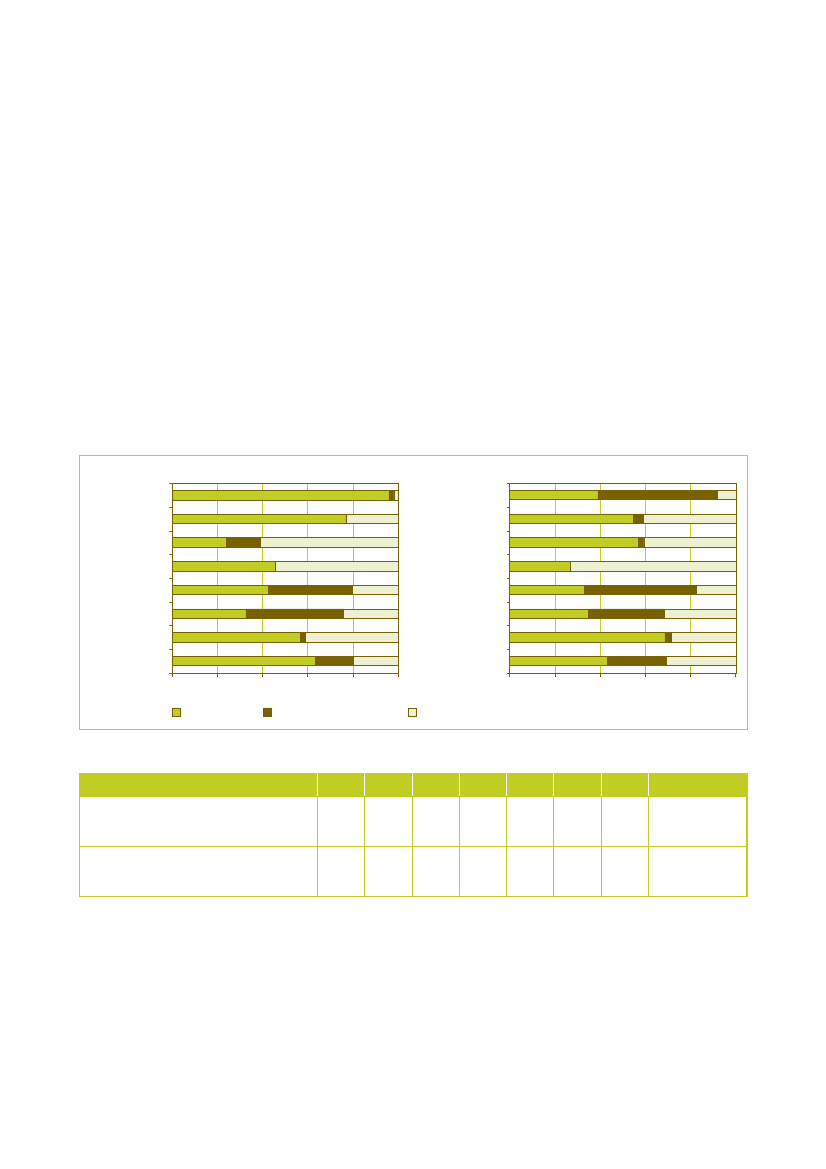
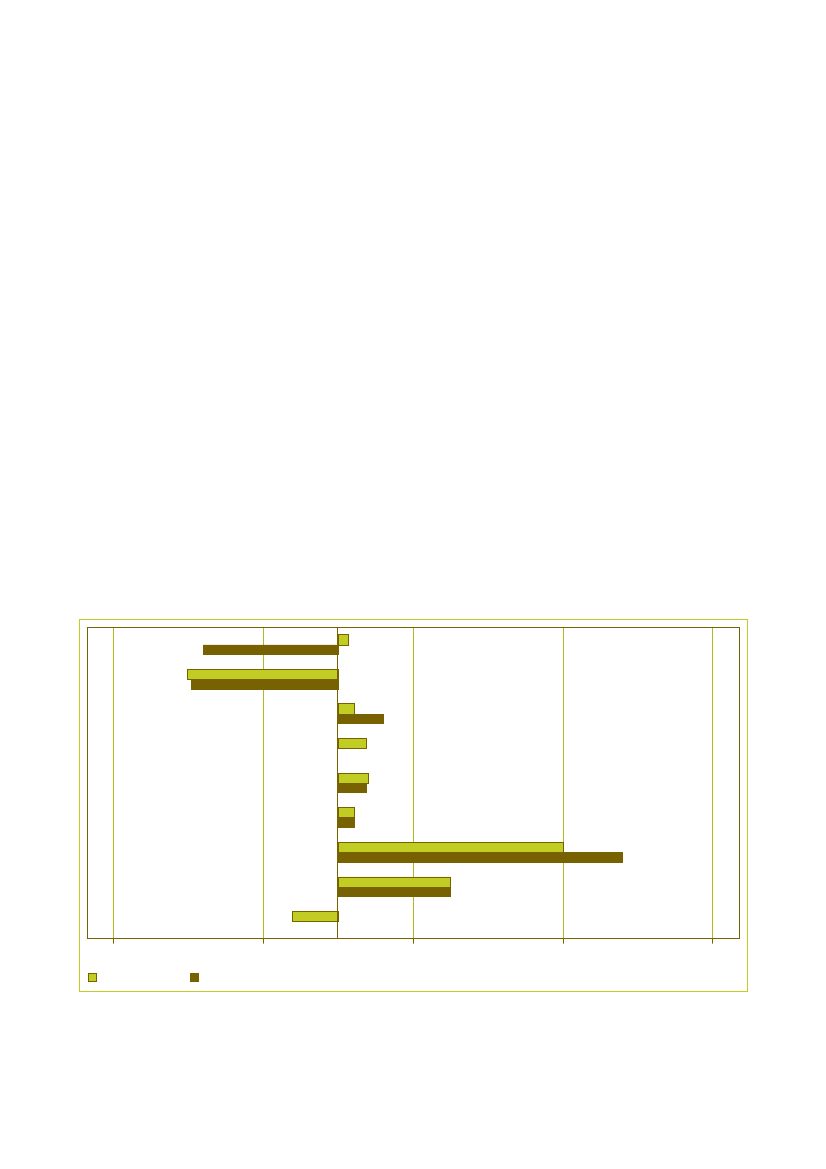
Figure 4.1: Overall scores per product group on indicator 1CleaningConstructionElectricityCateringGardeningOffice ITPaperClothingTransportFurniture0%20%40%60%80% 100%
Core greenComprehensive greenNon green
The results for indicators 1 and 2 basically follow from the‘score’ (core green, comprehensive green or non-green)of a respondent on a product group. For indicator 1,these scores are multiplied with the correspondingvolume spent by the respondent. For indicator 2, thescores are multiplied with the number of organisations a6respondent purchases on behalf of (1 or higher) .
Table 4.1: Overall scores per product group on indicator 1Indicator 1CleaningConstructionCore green15%19%63%43%12%57%5%40%19%82%Comprehensivegreen33%18%17%0%14%3%72%7%0%0%Non-green52%63%20%57%74%41%23%53%81%18%
4.1
Summary
ElectricityCatering
The figures and tables below show that the levels of GPPdiffer widely between the ten product groups (weightedaverage on the seven Member States). Electricity, officeIT and furniture attaining the highest scores; productgroups construction, gardening and transport the lowest.Within product groups cleaning and paper, the levels ofcompliance with comprehensive green criteria are highestamong all product groups. Differences in the level of GPPare caused by differences in scores on the underlyingcore and comprehensive green criteria. We will examinethis within the remaining part of this chapter.
GardeningOffice ITPaperClothingTransportFurniture
6
For more details on the computation of indicators 1 and 2, we refer to the separate report on methodologies.
Collection of statistical information on Green Public Procurement in the EU
39
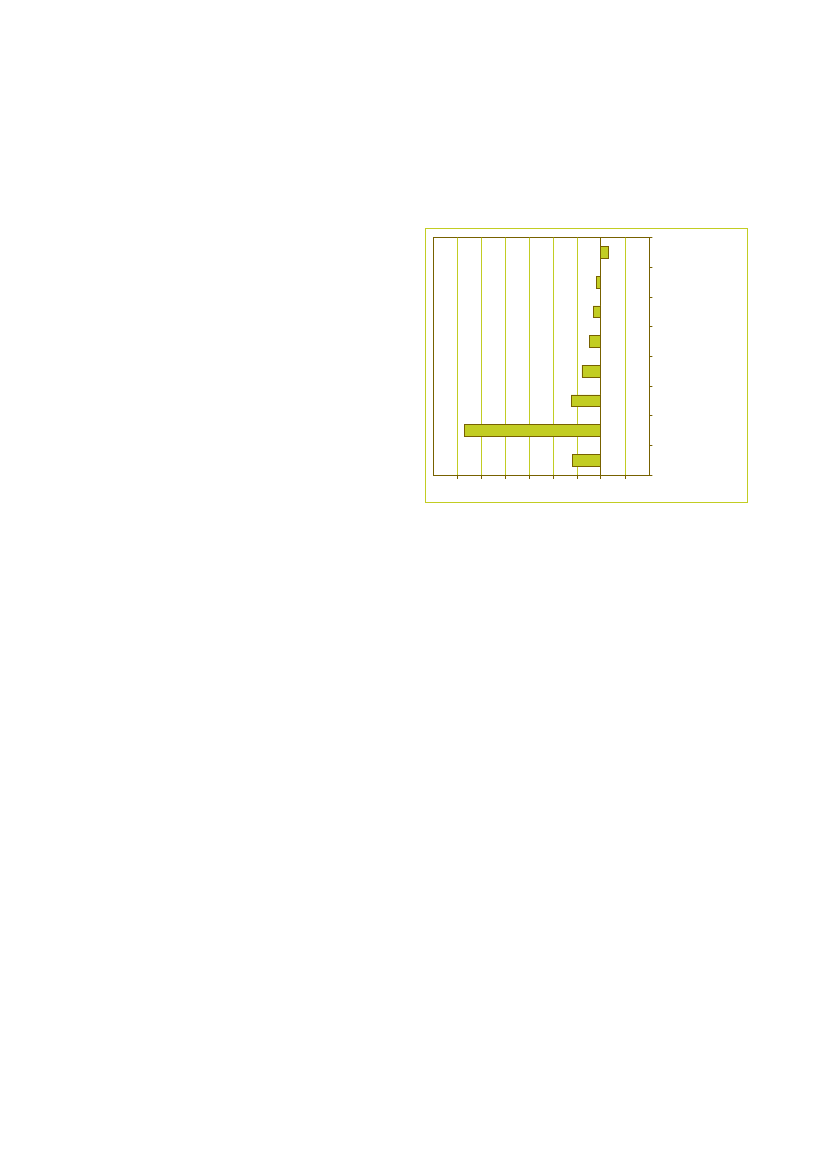
Figure 4.2: Overall scores per product group on indicator 2CleaningConstructionElectricityCateringGardeningOffice ITPaperClothingTransportFurniture0%20%40%60%80% 100%
Core greenComprehensive greenNon green
Table 4.2: Overall scores per product group on indicator 2Indicator 2CleaningConstructionElectricityCateringGardeningOffice ITPaperClothingTransportFurnitureCore green25%20%43%31%6%72%7%29%36%77%Comprehensive Non-greengreen35%7%26%0%3%4%50%10%0%0%41%72%31%69%92%24%44%61%64%23%
40
PricewaterhouseCoopers
4.2
Cleaning products & services
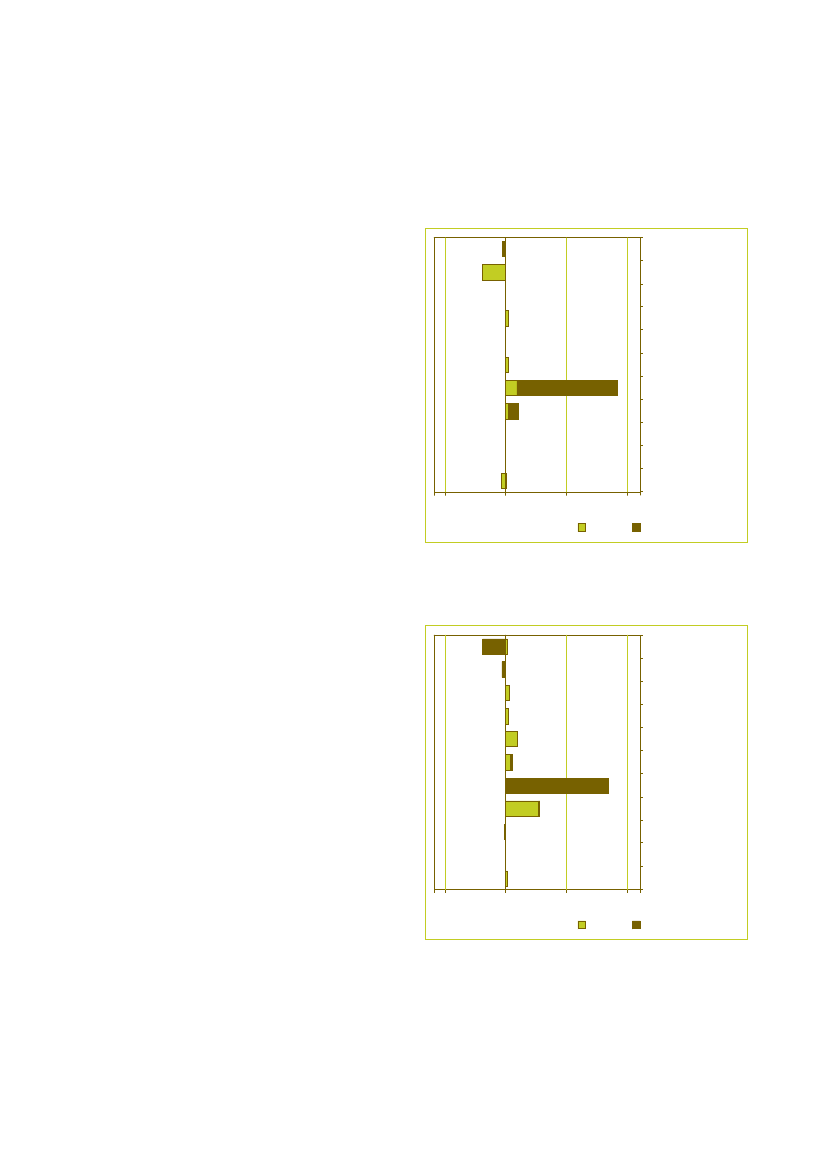
For this product group 351 out of 601 respondentsconcluded a procurement contract in 2006 or 2007.Variation in the level of GPP between the member states7is high . As for Austria and Germany, levels of GPP arelow, due to the relatively low score on the sole core greencriterion (on the avoidance of hazardous substances). Incase the contracted services comply with an appropriateecolabel, such as the European Ecolabel, the contract is8identified to be core green too . Within most MemberStates, scores on the two comprehensive green criteriaare remarkably high (see Table 4.3).Figure 4.3: Overall scores product group cleaningIndicator 1 (% of proc. Value)AustriaDenmarkFinlandGermanyNetherlandsSwedenUnited KingdomTotal0%20%Core green40%60%80% 100%
In addition, we analysed the correlation between the GPPlevel of a respondent and the way he has implementedGreen Public Procurement within his organisation (seeChapter 2). For some product groups, this leads to9significant results . For the product group cleaning forexample, the GPP level is significantly higher withinorganisations that have an environmental component intheir procurement policy. 62% of the organisationshaving such a policy attains a core or comprehensivelevel of GPP. With regard to the other organisations, only41% attain those levels.Hence: for this product group, implementation efforts payoff.
Indicator 2 (% of # contracts)AustriaDenmarkFinlandGermanyNetherlandsSwedenUnited KingdomTotal0%Non green20%40%60%80% 100%
Comprehensive green
Table 4.3: Percentage of organisations complying with a green criterion for product group cleaningCriterionDoes the contractor avoid the use of hazardous substances?Are all cleaning staff employed in carrying out the serviceregularly trained for their various tasks?Does the contractor use reusable microfibre cloths and/or applydry-cleaning techniques for linoleum flooring where appropriate?Is the acquired product or service being certified by an ecolabelor does it comply with underlying criteria of an ecolabel?AU35%52%60%42%DK55%87%67%80%FIN48%81%66%41%GER39%47%48%42%NL44%79%66%48%SWE66%79%80%61%UK56%95%56%39%GPP-levelCoreCompre-hensiveCompre-hensiveCore (forcertainecolabels)
78
9
‘Total’ in the figures below refers to the weighted average over all countries.The tables in this chapter contain the percentages of all respondents who indicated that their product or service was certified by an ecolabel or didcomply with the underlying criteria. It must be noted, that a ‘yes’-answer to this question does not automatically lead to a green level of publicprocurement. This depends on the actual ecolabel or applied criteria.Based on a so-called Pearson Chi-Square statistical test. Only statistical significant results are presented in this report. This means that with highconfidence (95%), the found results are ‘real’ and not based on statistical chance.41
Collection of statistical information on Green Public Procurement in the EU
4.3
Construction
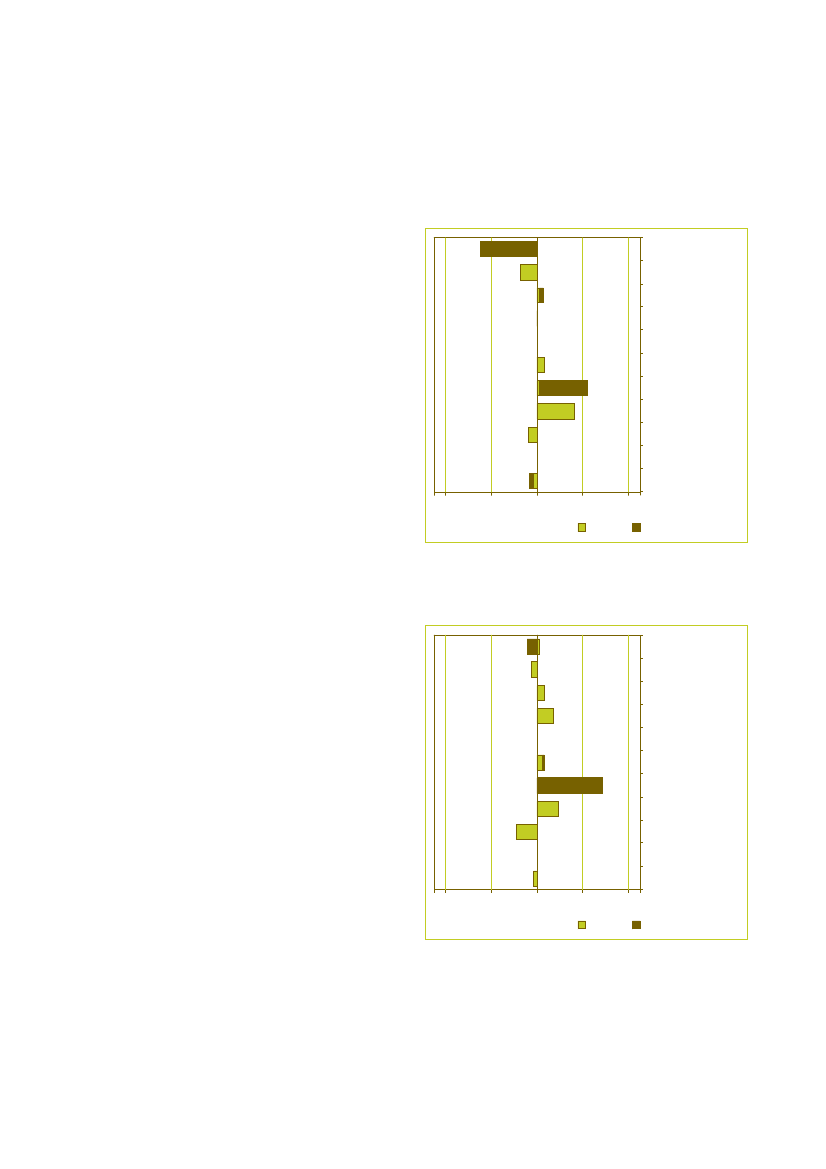
This explains the overall low level of GPP to aconsiderable extent.It appears that most buildings have been designed so asto reduce the energy consumption. What are theseenergy-saving measures that have been taken? The tablebelow shows that double glazing and insulation havebeen applied most frequently.
For this product group 188 out of 532 respondentsconcluded a procurement contract in 2006 or 2007. Formost Member States, the GPP levels are relatively low,except for the UK. A closer look at the percentages percriterion, shows us that the majority of the constructedbuildings are not guaranteed free of hazardous materials.Figure 4.4: Overall scores product group constructionIndicator 1 (% of proc. Value)AustriaDenmarkFinlandGermanyNetherlandsSwedenUnited KingdomTotal0%20%Core green40%60%80% 100%
Indicator 2 (% of # contracts)AustriaDenmarkFinlandGermanyNetherlandsSwedenUnited KingdomTotal0%Non green20%40%60%80% 100%
Comprehensive green
Table 4.4: Percentage of organisations complying with a green criterion for product group constructionCriterionHas the building been designed and built to reduce the amountof energy consumed in use?Are all sanitary and kitchen water facilities being equipped withthe latest water-saving technologies available on the market?Has the contracted party declared that the no hazardousmaterials/substances have been used in the construction?Does all timber used in the building come from legal sources?Has a minimum of the energy demand been defined that has tobe provided by localised renewable energy sources?AU85%40%33%44%13%DK68%51%33%27%15%FIN92%48%17%75%0%GER100%63%42%56%28%NL91%44%28%60%15%SWE98%59%37%65%12%UK100%55%35%89%22%GPP-levelCoreCoreCoreCoreCompre-hensive
Table 4.5: Energy saving measures taken in product group construction (% of organisations)What are these energy-saving measures(multiple options)?Natural ventilationDouble glazingInsulationDesign to make best use of natural lightOtherAustria32%56%68%44%12%Denmark39%70%70%51%21%Finland0%39%55%13%23%Germany58%86%86%86%28%TheNetherlands30%67%63%40%23%Sweden24%67%71%37%31%UnitedKingdom75%90%90%75%40%
42
PricewaterhouseCoopers
4.4
ElectricityFor some countries, large differences can be seen in thelevels of GPP based on the procurement value on the onehand (i.e. indicator 1), and based on the number ofcontracts on the other (indicator 2). For Austria, thisdifference is large in particular: comprehensive green ishigh on indicator 2, whereas core green is the dominantlevel on indicator 1. This is due to the fact, that in Austriaone governmental organisation has a very large contract.The contract that was concluded by this organisation,matches a core green level. This explains the highpercentage of core green public procurement onindicator 1. On indicator 2, the impact of this contract ismuch smaller.
For this product group 320 out of 551 respondentsconcluded a procurement contract in 2006 or 2007. Thecountry differences on the level of GPP are clearlyreflected in the scores on the separate green criteria.Austria and the Netherlands attain the highest levels ofGPP; within these countries a large majority of thegovernmental organisations procured electricity fromrenewable sources (for at least 50%).Based on a correlation analysis, it follows thatorganisations having an action plan for meeting goals ongreen procurement, attain significantly higher levels ofGPP. 75% of the organisations having such a plan, buysgreen, against 61% for the other organisations only.Figure 4.5: Overall scores product group electricityIndicator 1 (% of proc. Value)AustriaDenmarkFinlandGermanyNetherlandsSwedenUnited KingdomTotal0%20%Core green40%60%80% 100%
Indicator 2 (% of # contracts)AustriaDenmarkFinlandGermanyNetherlandsSwedenUnited KingdomTotal0%Non green20%40%60%80% 100%
Comprehensive green
Table 4.6: Percentage of organisations complying with a green criterion for product group electricityCriterionDoes (part of) the supplied electricity comefrom renewable energy sources?Is the acquired product or service beingcertified by an ecolabel or does the product orservice meet its underlying criteria?AU88%DK49%FIN35%GER26%NL80%SWE62%UK66%GPP-levelCore (50-99%) orcomprehensive(100%)Core (for certainecolabels)
33%
4%
17%
7%
43%
46%
13%
Collection of statistical information on Green Public Procurement in the EU
43
4.5
Catering & foodLarge differences can be seen between organisations.For example, 46% of the organisations having anenvironmental component in their procurement policy,buys green catering, against 6% for other organisationsonly. Similar relations exist between organisations thathave an action plan for green procurement and theattained level of GPP.
For this product group 141 out of 527 respondents10concluded a procurement contract in 2006 or 2007 . Inthis study, no comprehensive green criteria have beentaken into account. So respondents could attain a coregreen level of GPP only. Differences on indicator 2 arerelatively small, except for Finland. Within this country, asmall part of the supplied products was producedorganically (29% against a Green-7 average of 57%) andselected according to the natural season (19% against42%). As can be seen from a comparison betweenindicators 1 and 2, in Germany, one or more largeorganisations concluded core green catering contracts.Figure 4.6: Overall scores product group catering & foodIndicator 1 (% of proc. Value)AustriaDenmarkFinlandGermanyNetherlandsSwedenUnited KingdomTotal0%20%Core green40%60%80% 100%
Indicator 2 (% of # contracts)AustriaDenmarkFinlandGermanyNetherlandsSwedenUnited KingdomTotal0%Non green20%40%60%80% 100%
Comprehensive green
Table 4.7: Percentage of organisations complying with a green criterion for product group catering & foodCriterionHas part of the range of products been producedorganically?Are the main fruit, vegetables and fish that are usedwhenever possible, being selected according to theseason based on the geographical location in which theassignment is performed?Is the acquired product or service being certified by anecolabel or does the product or service meet itsunderlying criteria?AU63%39%DK84%45%FIN29%19%GER56%61%NL42%34%SWE57%22%UK67%74%GPP-levelCoreCore
26%
14%
19%
25%
24%
22%
29%
Core (for certainecolabels)
10
Results for Sweden are based on less than 10 observations.
44
PricewaterhouseCoopers
4.6
Gardening
For this product group 109 out of 504 respondents11concluded a procurement contract in 2006 or 2007 . Theoverall level of GPP for gardening is relatively low,compared to other product groups. Results betweencountries differ widely, on the level of a single criteriontoo. A comprehensive level of GPP can be attained onlyin case the acquired soil improvers comply with(underlying criteria of) a certain ecolabel, such as theEuropean Ecolabel.Figure 4.7: Overall scores product group gardeningIndicator 1 (% of proc. Value)AustriaDenmarkFinlandGermanyNetherlandsSwedenUnited KingdomTotal0%20%Core green40%60%80% 100%Non greenAustriaDenmarkFinlandGermanyNetherlandsSwedenUnited KingdomTotal0%20%40%60%80% 100%Indicator 2 (% of # contracts)
Comprehensive green
Table 4.8: Percentage of organisations complying with a green criterion for product group gardeningCriterionDid you purchase gardening machines that can run onunleaded petrol with a benzene content of <1.0 % byvolume, alkylate petrol, class A diesel oil, orbiofuel-based engine fuel?Are the following substances being excluded from thepurchased products? Peat, Sewage sludgeAre the acquired soil improvers being certified by anecolabel or does the product meet its underlying criteria?AU22%DK46%FIN27%GER28%NL8%SWE43%UK39%GPP-levelCore
14%20%
46%23%
0%48%
42%16%
27%20%
45%28%
63%52%
CoreComprehen-sive(for certainecolabels)
11
Results for Denmark are based on less than 10 observations.
Collection of statistical information on Green Public Procurement in the EU
45
4.7
Office IT EquipmentAgain, the level of GPP is highly correlated to the wayrespondents have implemented sustainable procurementwithin their organisation. 76% of the respondents whosaid to have a procurement policy containingenvironmental aspects, attains a green level (core orcomprehensive). This holds for 45% of the otherorganisations only. Similar percentages hold for thequestion whether an organisation has a sustainableprocurement action plan.
For this product group 278 out of 524 respondentsconcluded a procurement contract in 2006 or 2007. Ascan be clearly seen, overall levels of GPP for this productgroup are high. Germany scores highest of the Green-7;93% of the respondents acquired IT equipment meetingthe latest Energy Star standards, and/or has asustainable design. Within some countries, organisationsacquired equipment complying with ecolabel standardslike Nordic Swan or Blaue Engel.Figure 4.8: Overall scores product group office IT equipmentIndicator 1 (% of proc. Value)AustriaDenmarkFinlandGermanyNetherlandsSwedenUnited KingdomTotal0%20%Core green40%60%80% 100%
Indicator 2 (% of # contracts)AustriaDenmarkFinlandGermanyNetherlandsSwedenUnited KingdomTotal0%Non green20%40%60%80% 100%
Comprehensive green
Table 4.9: Percentage of organisations complying with a green criterion for product group office IT equipmentCriterionDo (part of the) products meet the latest ENERGY STARstandards for energy performance?Have PCs and notebooks been designed so that: Thememory is readily accessible and can be changed; Thehard disk and, if available, the CD drive and/or DVDdrive, can be changed?Is the acquired product or service being certified by anecolabel or does the product or service meet itsunderlying criteria?AU69%96%DK70%50%FIN60%70%GER93%93%NL59%77%SWE82%82%UK70%81%GPP-levelCoreCore
24%
36%
31%
44%
22%
52%
30%
Core or compreh.(depending onecolabel)
46
PricewaterhouseCoopers
4.8
Paper
For this product group 285 out of 541 respondentsconcluded a procurement contract in 2006 or 2007.Overall levels of GPP are relatively high for the productgroup paper. Remarkably, the level of comprehensivegreen procurement is highest of all product groups. Thisis due to the very high percentage of organisations thatacquired ecolabel compliant paper (European Ecolabel,Blaue Engel or Nordic Swan).Figure 4.9: Overall scores product group paperIndicator 1 (% of proc. Value)AustriaDenmarkFinlandGermanyNetherlandsSwedenUnited KingdomTotal0%20%Core green40%60%80% 100%Non greenAustriaDenmarkFinlandGermanyNetherlandsSwedenUnited KingdomTotal0%20%40%60%80% 100%Indicator 2 (% of # contracts)
Comprehensive green
Table 4.10: Percentage of organisations complying with a green criterion for product group paperCriterionHas all (recycled) office paper been made from 100%recovered paper fibres?Is all paper at least Elementary Chlorine Free (ECF) orTotally Chlorine Free (TCF)In case of paper based on virgin fibres, do the virginwood fibres for pulp production come from sustainablemanagement forests?Is the acquired product or service certified with anecolabel or does the product or service meet itsunderlying criteria?AU23%92%32%DK35%68%47%FIN20%33%41%GER9%80%47%NL34%74%55%SWE36%78%13%UK7%80%87%GPP-levelCoreCoreCore
77%
80%
75%
90%
72%
87%
87%
Comprehensive(for certainecolabels)
Collection of statistical information on Green Public Procurement in the EU
47
4.9
Textiles
For this product group 137 out of 514 respondentsconcluded a procurement contract in 2006 or 2007.Country differences are relatively high for this productgroup. In Denmark, the majority of the acquired clothingmeets ecological criteria of certain ecological standardsor ecolabels. Within Finland and the UK, a small part ofthe products meets such criteria.Figure 4.10: Overall scores product group textilesIndicator 1 (% of proc. Value)AustriaDenmarkFinlandGermanyNetherlandsSwedenUnited KingdomTotal0%20%Core green40%60%80% 100%Non greenAustriaDenmarkFinlandGermanyNetherlandsSwedenUnited KingdomTotal0%20%40%60%80% 100%Indicator 2 (% of # contracts)
Comprehensive green
Table 4.11: Percentage of organisations complying with a green criterion for product group textilesCriterionDo the products meet the ecological criteria relating tothe product itself and production processes of theÖko-Tex Standard 100 or European Ecolabel?Is the acquired product or service being certified by anecolabel or does the product or service meet itsunderlying criteria?AU18%DK69%FIN17%GER25%NL25%SWE32%UK0%GPP-levelCore
50%
50%
11%
16%
29%
21%
11%
Core or compreh.(depending onecolabel)
48
PricewaterhouseCoopers
4.10
TransportFor Austria and Germany, differences between indicator 1and 2 results are high. This can be explained (again) byfew major buyers within these countries. In Austria theacquired vehicles did not meet the core level criteria. InGermany, on the other hand, they did.
For this product group 195 out of 511 respondentsconcluded a procurement contract in 2006 or 2007. Thelevel of core GPP for transport is relatively high. Themajority of the acquired vehicles comply with certainmaximum CO2levels. The EURO 5 standard criterionappears to be less complied with, as can been seen fromthe table. In this study, no comprehensive green levelcould be attained for this product group.Figure 4.11: Overall scores product group transportIndicator 1 (% of proc. Value)AustriaDenmarkFinlandGermanyNetherlandsSwedenUnited KingdomTotal0%20%40%60%80% 100%
Indicator 2 (% of # contracts)AustriaDenmarkFinlandGermanyNetherlandsSwedenUnited KingdomTotal0%Non green20%40%60%80% 100%
Core green
Comprehensive green
Table 4.12: Percentage of organisations complying with a green criterion for product group transportCriterionDo (part of) the vehicles comply with the followingmaximum average CO2emissions per vehicle segment(see methodologies report)?Do the purchased vehicles comply with the EURO 5standard?AU85%DK77%FIN60%GER53%NL47%SWE81%UK59%GPP-levelCore
67%
27%
46%
40%
26%
51%
31%
Core
Collection of statistical information on Green Public Procurement in the EU
49
4.11
FurnitureFrom the correlation analyses it appears that (again)organisations having an environmental orientedprocurement policy, buy green furniture more often (70%)than others (50%). Similar (significant) correlations can beseen between the level of GPP and the tendency toevaluated supplier proposals on Life Cycle Costing(instead of on the procurement costs only).
For this product group 219 out of 522 respondentsconcluded a procurement contract in 2006 or 2007. Asfor transport, no comprehensive level of GPP could beattained on furniture. However, as can be seen from thefigures, the large majority of the organisations meet thecore level criteria. This is partly due to the fact that quitea large part of the acquired furniture has been certified byappropriate ecolabels, such as Bra Miljöval, GreenGuard, and Blaue Engel.Figure 4.12: Overall scores product group furnitureIndicator 1 (% of proc. Value)AustriaDenmarkFinlandGermanyNetherlandsSwedenUnited KingdomTotal0%20%Core green40%60%80% 100%
Indicator 2 (% of # contracts)AustriaDenmarkFinlandGermanyNetherlandsSwedenUnited KingdomTotal0%Non green20%40%60%80% 100%
Comprehensive green
Table 4.13: Percentage of organisations complying with a green criterion for product group furnitureCriterionDo all wood and wood-based materials come from legallysourced timber?Is the acquired product or service being certified by anecolabel or does the product or service meet its underlyingcriteria?AU100%18%DK57%48%FIN72%41%GER74%53%NL56%27%SWE78%46%UK93%40%GPP-levelCoreCore (forcertainecolabels)
50
PricewaterhouseCoopers
5CO impact of Green2
Public Procurement
Apart from indicators that measure the levels ofGPP, we also have developed two indicatorsthat measure the impact of GPP in terms of CO2and in terms of costs for the user of a product(indicator 3 and 4 respectively). This chapterdescribes the main results on indicator 3,broken down by country, while results onindicator 4 are presented in chapter 6. Moredetailed data sheets are presented inAppendix E.
percentage between core and comprehensive is equal(as comprehensive is at least core).Table 5.1: CO2impact of GPP per functional unit. Negativenumbers imply reductions in CO2emissions.Product groupCleaning servicesConstructionElectricityCatering & foodunitm2cleanedbuildingkWhlunch preparedm2gardencomputerkg paperkg textilevehiclecore0%-69%-26%0%-100%-24%-97%-76%-12%-100%-24%-89%-76%compre-hensive-100%-70%-100%
5.1
CO2impact of GPP per functional unit
GardeningOffice IT equipment
The CO2impact of Green Public Procurement isdetermined by the difference in CO2emissions between agreen product and a non-green product. The followinglimitations apply to our analysis:lWe only focus on CO2emissions; other environmentalimpacts are not taken into accountlCO2equivalents are not included in our analysislThe study does not include a full Life Cycle Analysisper product groupFor a more detailed description of these limitations, werefer to the separate report on methodologies.The differences in CO2emissions between a greenproduct and a non-green product allow us to calculatethe CO2per functional unit of a product group. “Per”functional unit means for example per vehicle for the2product group transport or per m floor cleaned forcleaning services. The table below illustrates thedifference in CO2impact of the ten product groups, bothfor the core and comprehensive levels of GPP. Thepercentages indicate the difference between the CO2emissions of a core and comprehensive green productcompared to a non-green product.The table shows that for all product groups, GPPresults in a reduction of CO2
emissions. Only for coregreen cleaning services and catering, we have foundthat GPP has no CO2
impact.Electricity, construction,cleaning services and paper are the only product groupswhere a distinction between a core and comprehensiveproduct is made. For furniture the CO2impact was notcalculated since it was found that reliable CO2data wasnot available concerning compliance with the criteriaincluded in the questionnaire. For the other productgroups only core criteria were applied and therefore the
PaperTextilesTransport
5.2
CO2impact of GPP in 2006/2007
In this section, we have linked the results of the CO2impact per functional unit to the results of indicator 1(level of green procurement in terms of procurementvalue). This link allows us to determine the actual CO2impact of GPP in 2006/2007. It must be noted that noresults are shown for the product group furniture, since itwas found that no reliable financial data was availableconcerning the criteria asked in the questionnaire. Firstly,we will give a summary of the results for all countries andthen we will break down the results on a country level.5.2.1Summary of resultsThe CO2impacts of GPP in the Green-7 in 2006/2007 areshown in Figure 5.1. These results are averaged for allproduct groups and weighted on the basis of the relativetotal CO2emissions per product group per country. Thenumbers in the figure should be interpreted in thefollowing way:a negative percentage means that CO2
emissions are reduced because of GPP. Therefore, anegative CO2
impact means that less CO2 is emitted.
Collection of statistical information on Green Public Procurement in the EU
53
Figure 5.1: CO2impact of GPP per country. Negativenumbers imply reductions in CO2emissions.
-47%-39%-38%-18%-15%-11%-9%-25%-60% -50% -40% -30% -20% -10%0%
The NetherlandsSwedenUnited KingdomFinlandDenmarkAustriaGermanyGreen-7 average
paragraphs. To aggregate all product groups on acountry level, a third parameter is used:3. The country-specific relative total CO2emissions perproduct group, which are used to weigh the productgroups into one figure per country. The higher arelative CO2emissions volume of a product group, themore the overall CO2impact of GPP in the country isdetermined by the financial impact of this productgroup. Below we show the results for the average CO2emissions. As can be seen from the table,electricity,construction and paper are essentially the onlythree product groups that determine a country’soverall CO2
impact of GPP.Table 5.2: Average relative CO2emissions per product groupproduct groupCleaning servicesConstructionElectricityRelative CO2emissions0%31%63%0%0%0%5%0%0%
As can be seen in the figure, the average reduction of CO2emissions because of GPP in the Green-7 is a substantial25%. It is important to note that this 25% specificallyrelates to the green purchase of the ten product groupssubject to this study. The average CO2emissions impactvaries from -9% in Germany to -49% in the Netherlands.Three out of the seven countries (i.e. The Netherlands,Sweden and the United Kingdom) have a large CO2impactof around -40% or higher. In the other four countries, theCO2impact of GPP is a bit lower at around -13%In order to explain these differences between countries,we need to examine the various parameters thatdetermine the overall CO2impact of GPP in a country.These parameters are (see section 1.3 for a more detaileddescription):1. The country-specific levels of green procurement perproduct group. If this level is zero, then the CO2impact of this product group logically is also 0%. Thehigher the level of GPP, the higher the CO2impact canbecome.2. The country-specific CO2impact per functional unit ofa product group (e.g. CO2impact per purchased2vehicle or per m cleaning services). Some productgroups have a higher CO2impact per functional unit(e.g. paper), while the CO2impact of GPP for otherproduct groups may be zero (e.g. catering)With the use of these two parameters, we determine the2006/2007 CO2impact per product group for a specificcountry. These results will be presented in subsequent
Catering & foodGardeningOffice IT equipmentPaperTextilesTransport
These three parameters allow us to explain the high CO2impact of GPP in the Netherlands as compared to theother countries. It is a result of the fact that for electricity,the level of green purchases is high in the Netherlands(see chapter 3). Especially the purchasing ofcomprehensive green electricity (i.e. 100% RES-E) is highcompared to the other countries. The purchasing ofelectricity, which has a comprehensive green CO2impactper kWh of -100%, weighs heavily in the determination ofthe overall figures. The same applies for Sweden. In theUK, the large impact is explained by the large percentageof green procurement for construction. In the followingsections, we will examine the CO2impacts per productgroup more closely on a country level. It should be notedthat for catering services, the CO2impact is zero in everycountry, since it was found that the use of green criteria(i.e. procurement of food that is produced organically)does not have a CO2impact for this product group. Formore details, we refer to the separate report onmethodologies.
54
PricewaterhouseCoopers
5.2.2AustriaIn Austria, the use of green criteria in purchasing has ledto a reduction of CO2emissions of 11%. The largest CO2impact can be found for paper, of which 100% of thepurchases are green, as was found in chapter 3. The CO2impact of GPP of transport and gardening is 0%, sincethe level of GPP for these product groups is also 0% inAustria.It is interesting to note that for electricity, of which 96%of the purchases are core green, the CO2impact is low.This is a result of the fact that the energy mix of Austriaalready contains a large percentage of RES-E. Therefore,the CO2impact for core green electricity in Austria iszero. The 2% impact is completely attributed to thecomprehensive green purchases of electricity.
Figure 5.2: CO2impact of GPP in Austria. Negative numbersimply reductions in CO2emissions.-4%-25%-2%Cleaning servicesConstructionElectricity
0% Catering & food0%-10%-90%-21%GardeningOffice IT equipmentPaperTextiles0% Transport
-11%-100% -80%-60%-40%-20%Core
weighted average0%Comprehensive
5.2.3DenmarkDenmark has an average CO2impact of GPP of -15%.The product groups with the higher impact are gardening,textiles and cleaning services, of which the levels of GPPin terms of procurement value are 92%, 77% and 93%respectively. The reason why cleaning services does nothave the largest CO2impact is because there is only aCO2impact for comprehensive green purchases (i.e. theuse of microfiber cloths), of which the level is 40% inDenmark. Transport has, as in Austria, a low CO2impactfrom GPP. This is because only 9% of the publiclypurchased cars in Denmark can be considered to begreen.
Figure 5.3: CO2impact of GPP in Denmark. Negativenumbers imply reductions in CO2emissions.-43%-8%-20%0%-92%-18%-8%-50%-1%Cleaning servicesConstructionElectricityCatering & foodGardeningOffice IT equipmentPaperTextilesTransport
-15%-100% -80%-60%-40%-20%Core
weighted average0%Comprehensive
Collection of statistical information on Green Public Procurement in the EU
55
5.2.4FinlandFinland has a CO2impact from GPP of -18%. It isinteresting to note that for cleaning services, thecomprehensive level of GPP is 66%, which results in ahigh CO2impact for this product group. The reason whythis does not show in the overall (average) figure, isbecause the CO2emissions of cleaning services arerelatively low compared to those of construction andelectricity. The CO2impact of gardening is 0%, sincenone of the purchases in Finland can be considered asgreen for this product group. Again we see that CO2reductions resulting from the green procurement oftransport is low. This is again a result of the fact that thelevel of GPP for transport is only 34%. This percentage iseven lowered in terms of CO2emissions, since the CO2impact per vehicle is -12%, which is low compared toother product groups.
Figure 5.4: CO2impact of GPP in Finland. Negative numbersimply reductions in CO2emissions.-68%-15%-19%0%0%-15%-26%-41%-4%Cleaning servicesConstructionElectricityCatering & foodGardeningOffice IT equipmentPaperTextilesTransport
-18%-100% -80%-60%-40%-20%Core
weighted average0%Comprehensive
5.2.5GermanyThe country with the lowest CO2impact from GPP,compared to the other countries in the Green-7, isGermany. However, the impact can still be considered assubstantial with a 9% reduction of CO2emissions. Thereason why it is not as high as in the other countries, isbecause the CO2impact of those product groups whichdetermine the total CO2impact in Germany (i.e.construction and electricity), are low at -4% and -18%respectively.On the positive side, the CO2impact of office ITequipment is highest in Germany compared to the othercountries. This is a result of the fact that 96% of thecomputers and monitors purchased in Germany aregreen.
Figure 5.5: CO2impact of GPP in Germany-12%-4%-18%0%0%-23%-33%-23%-8%Cleaning servicesConstructionElectricityCatering & foodGardeningOffice IT equipmentPaperTextilesTransport
-9%-100% -80%-60%-40%-20%Core
weighted average0%Comprehensive
56
PricewaterhouseCoopers
5.2.6The NetherlandsAlthough the level of GPP in terms of procurement valuein the Netherlands is the lowest of the Green-7, theamount of CO2reductions is the highest at 47%. Thisresults from the large amounts of comprehensive greenpurchases of electricity. 43% of the purchased electricityin the Netherlands has at least 50% electricity fromrenewable energy sources, and 37% of the electricity is100% RES-E. Since the fuel mix in the Netherlands doesnot contain a large proportion op RES-E, the CO2reductions can be high, even if only 50% of the electricityis from RES-E.Furthermore, the CO2impact of textiles, cleaning servicesand paper are also high in the Netherlands. Furthermore,we see again that the CO2impact of transport is low, only-1%, since only 8% of the purchased cars are consideredas green.
Figure 5.6: CO2impact of GPP in the Netherlands. Negativenumbers imply reductions in CO2emissions.-12%-4%-18%0%0%-23%-33%-23%-8%Cleaning servicesConstructionElectricityCatering & foodGardeningOffice IT equipmentPaperTextilesTransport
-9%-100% -80%-60%-40%-20%Core
weighted average0%Comprehensive
5.2.7SwedenAs can be seen in the figure below, the purchasing ofcomprehensive green products and services has led to alarge CO2impact of GPP in Sweden. As was explained insection 5.1.1, the high overall CO2impact is mainlycaused by the purchasing of electricity from 100%electricity from renewable energy sources. What is alsostriking is that 74% of the cleaning services in publicorganisations in Sweden can be considered ascomprehensive green. This leads to a high CO2impact ofGPP for this product group. The same applies for thecomprehensive purchasing of paper.
Figure 5.7: CO2impact of GPP in Sweden. Negative numbersimply reductions in CO2emissions.-74%-21%-44%0%-6%-22%-66%-14%-5%Cleaning servicesConstructionElectricityCatering & foodGardeningOffice IT equipmentPaperTextilesTransport
-39%-100% -80%-60%-40%-20%Core
weighted average0%Comprehensive
Collection of statistical information on Green Public Procurement in the EU
57
5.2.8United KingdomIn the United Kingdom, 38% CO2reductions are achievedthrough GPP compared to the situation in which no GPPwould be applied. The main part comes from compliancewith core criteria, which is a result of the large amounts ofcore green electricity in the UK. Furthermore, the amountof comprehensive green buildings in terms ofprocurement value (see textbox in section 3.1 for a moredetailed explanation) is also large in the UK at 49%.Textiles on the other hand, have a low CO2impact. Only4% of the publicly purchased clothing can be consideredas green.
Figure 5.8: CO2impact of GPP in the United Kingdom.Negative numbers imply reductions in CO2emissions.-38%-55%-27%0%-61%-18%-63%-3%-7%Cleaning servicesConstructionElectricityCatering & foodGardeningOffice IT equipmentPaperTextilesTransport
-38%-100% -80%-60%-40%-20%Core
weighted average0%Comprehensive
58
PricewaterhouseCoopers
6Financial impact of GPP
The previous chapter describes the variousimpacts of GPP in terms of CO2. In this chapter,we will present the results for the financialimpact of GPP (indicator 4). More detailed datasheets are presented in Appendix F.
6.1
Financial impact of GPP perfunctional unit
The results of these cost ratios (i.e. the financial impactper functional unit) are shown in the figure below, both forthe core and comprehensive levels of GPP. The graphshows how a product group can positively or negativelydetermine the overall financial impact of GPP, and also towhat extent.If a figure is negative, this means thatcost reductions can be achieved for that productgroup by purchasing green. On the other hand,positive numbers indicate increases in costs fromGPP.From the graph, we conclude that procurement ofgreen construction, green transport or cleaningservices with green comprehensive criteria can resultin a negative financial impact (i.e. cost reduction),while procurement of green textiles, green paper or100% electricity supplied from Renewable EnergySources (RES-E) can lead to non-negligible increasesin costs.Furniture is not included in this analysis, since itwas found that no reliable financial data was availableconcerning the criteria asked in the questionnaire.
The financial impact of Green Public Procurement isdetermined by the differences in costs between a greenproduct and a non-green product. These costs not onlyrelate to purchasing costs, but also to operational costsor costs for disposal. In the separate report onmethodologies we have performed Life Cycle Cost (LCC)analyses in order to determine both the cost structure ofa product (i.e. the relative percentages of the variouselements that make up the total costs for the user of aproduct) and, for all relevant elements in the user lifecycle, the cost ratios of green products as compared tonon-green products.
Figure 6.1: Financial impact of GPP per functional unit. Negative numbers imply reductions in costs and positive numbersimply increases in costs.
1%-9%-10%-10%ElectricityCatering & foodGardeningOffice IT equipmentPaperTextiles-3%-15%Core green-5%Comprehensive green
Cleaning services
Construction1%3%2%2%2%1%1%15%19%8%8%Transport5%15%25%
Collection of statistical information on Green Public Procurement in the EU
61
6.2
Financial impact of GPP in 2006/2007
In this section, we have linked the results of the costratios and cost structures to the results of indicator 1(level of green procurement in terms of procurementvalue). This link allows us to determine the actual financialimpact of GPP in 2006/2007. It must be noted that noresults are shown for the product group furniture, since itwas found that reliable financial data was not availableconcerning the criteria included in the questionnaire. Wewill first of all give a summary of the results for allcountries and then break the results down further on acountry level.6.2.1Summary of resultsThe financial impacts of GPP in the Green-7 in 2006/2007are shown in Figure 6.2. These results are averaged for allproduct groups and weighted on the basis of the relativetotal procurement value per product group per country.The numbers in the figure should be interpreted in thefollowing way:a negative percentage means that costsare reduced because of GPP. A percentage largerthan zero means that costs are increased comparedto the situation in which none of the purchases wouldbe green.In the Green-7, for which we have found in chapter 3that around 50% of the purchases are green, theaverage financial impact of GPP in 2006/2007 is -1%.This means that the use of green criteria in around 50%of the tendering procedures results in an averagedecrease of costs for public organisations of around 1%.Thus, when taking into account user life cycleconsiderations, Green Public Procurement does, incontrast to the common perception, not necessarily lead12to increases in costs . Better yet, our results show thatGPP has actually led to decreases in costs for publicorganisations in 2006/2007. The reason behind this isthat higher purchasing prices of green goods arecompensated by lower operating costs.
Figure 6.2: Financial impact of GPP in the Green-7. Negativenumbers imply reductions in costs and positive numbersimply increases in costs.0,31%-0,17%-0,32%-0,48%-0,79%-1,24%-5,70%United Kingdom-1,20%-5%-3%-1%1%Green-7 averageDenmarkNetherlandsGermanyAustriaFinlandSweden
On a country level, the figures vary from -5,70% in theUnited Kingdom to +0,31 in Denmark. In order to explainthese differences, we recapitulate the parameters thatinfluence the financial impact of GPP in a country (seesection 1.3 for a more detailed description):1. The country-specific levels of green procurement perproduct group. If this level is zero, then the financialimpact of this product group is logically 0%. Thehigher the level of GPP, the higher the financial impactcan be, either positive or negative;2. The financial impact per functional unit of a productgroup (e.g. financial impact per purchased vehicle or2per m cleaning services). Some product groups leadto cost reductions (e.g. construction and transport),while other product groups lead to increases in costs(e.g. paper and textiles).With the use of these two parameters, we determine the2006/2007 financial impact per product group for aspecific country. These results will be presented insubsequent paragraphs. To aggregate all product groupson a country level, a third parameter is used:3. The country-specific relative total procurementvolumes per product group, which are used to weighthe product groups into one figure per country. Thehigher a relative procurement volume of a product
12
This result was also found by Öko-Institut and ICLEI in: Costs and Benefits of Green Public Procurement in Europe. Part 1: Comparison of the LifeCycle Costs of Green and Non Green Products, July 2007.
62
PricewaterhouseCoopers
group, the more the overall financial impact of GPP inthe country is determined by the financial impact ofthis product group. Below we show the results for theaverage procurement values. As can be seen from thetable,construction, electricity, office IT equipmentand cleaning services are the product groups thatmostly influence the overall financial impact.Table 6.1: Average relative procurement values of the13Green-7 per product groupproduct groupCleaning servicesConstructionElectricityCatering & foodGardeningOffice IT equipmentPaperTextilesTransportRelative procurement value6%57%17%2%2%10%1%1%4%
These three parameters allow us to explain the highfinancial impact of GPP in the United Kingdom ascompared to the other countries. It is a result of the factthat for construction, the level of green purchases is highin the UK (see chapter 3). Construction, with a financialimpact per building of -10%, weighs heavily in thedetermination of the overall figures. The same applies theother way around: Denmark, where the financial impactof GPP is slightly positive, scores low in terms of % ofGPP for construction and transport. Since it is mainlythese product groups that lead to cost reductions (i.e.they have a negative financial impact per functional unit),the financial impact is not negative but positive as aresult of the other product groups for which the level ofGPP is higher.Overall, it is encouraging to conclude that from a lifecycle perspective, Green Public Procurement cancertainly lead to indirect cost reductions, albeit notmuch.In the following sections, we will examine thefinancial impacts per product group more closely on acountry level.
13
This data is retrieved from the questionnaire. By adding all the procurement values of all respondents in a country for all product groups, we wereable to determine the country-specific relative procurement volumes per product group.
Collection of statistical information on Green Public Procurement in the EU
63
6.2.2AustriaIn Austria, the overall financial impact of GPP is -0,48%.The reason why this number is close to zero is a result ofthe fact that the level of GPP is low in Austria for thoseproduct groups that have a higher financial impact perfunctional unit, either positive or negative. The onlyexception to this is the procurement of paper (our resultsshow green criteria are applied in 100% of the paperpurchases). However, since the total procurement valueof paper is not very high, paper does not heavilydetermine the overall financial impact of GPP.The financial impact for construction is alsonon-negligible. Compared to the other countries underscope, the overall financial impact is not as muchdetermined by construction, since the relative totalprocurement value in Austria is not as high. The reasonthat the financial impact of GPP for gardening is zero isbecause in none of the purchases, green criteria areapplied.
Figure 6.3: Financial impact of GPP in Austria. Negativenumbers imply reductions in costs and positive numbersimply increases in costs.-0,38%-3,83%0,03%0,49%0,00%0,37%18,47%Cleaning servicesConstructionElectricityCatering & foodGardeningOffice IT equipmentPaper2,08%-0,04%TextilesTransport
-0,48%-10%010%Core20%
weighted average
Comprehensive
6.2.3DenmarkThe overall financial impact of GPP in Denmark is +0,31%, which means that the use of green criteria in publicpurchasing has led to a slight increase in costs.Compared to the other countries under scope, Denmarkis the only county that has a positive financial impact ofGPP (meaning more costs). This results mainly from thehigh levels of GPP for paper and clothing (91% and 77%respectively), which lead to increases in costs, and fromthe low levels of GPP for construction and transport (11%and 10% respectively), which lead to decreases in costs.The only product group which direct to overall figure inthe negative direction is cleaning services, for which thelevel of GPP is 93%.
Figure 6.4: Financial impact of GPP in Denmark. Negativenumbers imply reductions in costs and positive numbersimply increases in costs.-3,40%-0,62%0,60%0,52%1,85%1,12%16,97%Cleaning servicesConstructionElectricityCatering & foodGardeningOffice IT equipmentPaper5,67%-0,25%TextilesTransport
0,31%-10%010%Core20%
weighted average
Comprehensive
64
PricewaterhouseCoopers
6.2.4FinlandAs can be seen in Figure 6.5, the overall financial impactof GPP in Finland is -0,79%. On a product group level, itis mainly paper and textiles where GPP leads toincreases in costs. The impact is not high though ascompared to the other countries under scope, as thelevel of GPP in Finland is not extremely high for theseproduct groups.Finland does however score high for cleaning services,where 76% of the procurement is considered to be green(of which 66% comprehensive green). Sincecomprehensive green services lead to decreases in costsof around -10% per functional unit, the financial impact ofGPP for cleaning services in Finland is -6,12%.
Figure 6.5: Financial impact of GPP in Finland, Negativenumbers imply reductions in costs and positive numbersimply increases in costs.-6,12%-1,77%0,68%0,05%0,00%0,79%5,43%4,09%-0,99%Cleaning servicesConstructionElectricityCatering & foodGardeningOffice IT equipmentPaperTextilesTransport
-0,79%-10%5%05%Core10%
weighted average
Comprehensive
6.2.5GermanyIn Germany, GPP has led to an overall decrease in costsfor public purchasers of -0,32%. Again paper and textileshave the highest positive financial impact. Also cateringservices, of which 94% of the purchases are green, leadto a relatively high positive financial impact.The product group which leads to the largest decrease incosts in Germany is transport with a financial impact of-2,2%. The financial impact of GPP for gardening is zero,as none of the public purchases of this product groupcan be considered to be green.
Figure 6.6: Financial impact of GPP in Germany. Negativenumbers imply reductions in costs and positive numbersimply increases in costs.-0,85%-0,62%0,75%1,77%0,00%0,78%Cleaning servicesConstructionElectricityCatering & foodGardeningOffice IT equipment7,14% Paper2,22%-2,20%TextilesTransport
-0,32%-10%5%05%Core10%
weighted average
Comprehensive
Collection of statistical information on Green Public Procurement in the EU
65
6.2.6The NetherlandsFigure 6.7 shows the financial impact of GPP per productgroup in the Netherlands. The positive impacts of paper,textiles and electricity are compensated by the negativeimpact of cleaning services, construction and transport.As a result, the overall financial impact attains a valuevery close to zero (-0,17%). The product group with thesmallest financial impact (apart from furniture), isgardening. The level of GPP for this product group interms of procurement value is a modest 6%.
Figure 6.7: Financial impact of GPP in the Netherlands.Negative numbers imply reductions in costs and positivenumbers imply increases in costs.-3,28%-0,97%2,26%0,45%0,12%0,53%13,34%3,97%-0,33%Cleaning servicesConstructionElectricityCatering & foodGardeningOffice IT equipmentPaperTextilesTransport
-0,17%-10%010%Core20%
weighted average
Comprehensive
6.2.7SwedenSweden is the country where GPP has led to thesecond-highest decrease is costs, namely -1,24%, ascan be seen in the figure below. It must be notedhowever that this is still a very low impact in terms ofcosts. The two product groups that have the highestnegative and positive financial impact are cleaningservices and paper respectively. For both productgroups, around 80% of the purchases are green (witharound 72% comprehensive green). The reason that thefinancial impact of cleaning services in Sweden innegative, is because the financial impact per functional2unit (i.e. per m floor cleaned) is negative. The same holdstrue in the opposite direction for paper.The overall figure is to a large extent determined byfinancial impact for construction. This is a result of thefact that the relative total procurement value of thisproduct is group is high compared to the other groups.
Figure 6.8: Financial impact of GPP in Sweden. Negativenumbers imply reductions in costs and positive numbersimply increases in costs.-6,62%-2,14%0,80%0,19%0,11%1,09%13,92%1,42%-1,11%Cleaning servicesConstructionElectricityCatering & foodGardeningOffice IT equipmentPaperTextilesTransport
-1,24%-10%010%Core20%
weighted average
Comprehensive
66
PricewaterhouseCoopers
6.2.8United KingdomThe largest cost reductions from GPP can be found in theUnited Kingdom. Overall, the financial impact is -5,70%,which is mainly determined by the large financial impactof construction. Our results for indicator 1 showconcerning construction in the UK that (1) the level ofGPP is high at 77% and that (2) the relative totalprocurement value of construction is high at 82%. Forfurther explanations, the reader is referred to the textboxin section 3.1.Furthermore, the green procurement of cleaning servicesand transport in the UK also has a negative financialimpact. The largest positive financial impact of GPP isonce again paper, of which 73% of the purchases areconsidered to be green. However, the relative totalprocurement value of this product group is fairly low.
Figure 6.9: Financial impact of GPP in the United Kingdom.Negative numbers imply reductions in costs and positivenumbers imply increases in costs.-3,44%Cleaning servicesConstruction-7,11%1,19%1,12%1,01%0,67%12,88%0,28%-1,74%ElectricityCatering & foodGardeningOffice IT equipmentPaperTextilesTransport
-5,70%-10%010%Core20%
weighted average
Comprehensive
Collection of statistical information on Green Public Procurement in the EU
67
7Conclusions
7.1
Current Green-7 level of GPP
The European Union has put Green Public Procurementon the agenda. This study shows that the Green-7Member States live up to their name by taking theinclusion of environmental criteria in their procurementprocedures seriously, both in policy and practice. Withinthe majority of public institutions, the procurement policycontains an environmental section. Mostly middlemanagement or a higher level is responsible for realizingambitions on sustainable procurement.The target set for the European Member States is 50%GPP by 2010. Up to now, efforts undertaken by theGreen-7 have lead to an average overall level for allcountries of 45% GPP of the total procurement value(indicator 1) and 55% GPP of the total amount ofcontracts (indicator 2). On a country level, indicator 1shows less variety between the countries than indicator2. On indicator 1 United Kingdom is the best performingcountry scoring a percentage of 74% on GPP, while theNetherlands scores lowest with 26%. On indicator 2Austria performs best with 62% and Germany comes lastin line with 46%.The differences in average percentage and countryranking between the two indicators is explained by thefact that with indicator 1 a high value contract weighsmore than a low value contract, while for indicator 2 bothcontracts weigh equally. It can thus be concluded thatDenmark is leading the Green-7 in procuring green onhigh value contracts (which can be assumed to becontract with a high environmental impact) while Austrialeads in implementing green procurement over the totalnumber of contracts.Within most countries a wide difference is shown on thelevel of GPP between the ten product groups. Overallelectricity, office IT and furniture attain the highestscores; product groups construction, gardening andtransport the lowest. Within product groups cleaning andpaper, the levels of comprehensive green criteria arehighest among all product groups.
procurement process are (1) the environmental impact ofthe purchase and (2) the availability of and the familiaritywith green alternatives. For this study we have specificallyfocused on calculating the CO2impact of GPP, taking intoaccount the current broad public involvement in reducinghuman impact on climate change.It can be concluded that GPP contributes to an averagereduction of CO2emissions of 25% when purchasinggreen on the ten product groups subject to this study.This means that public purchasers have the possibility tosubstantially reduce CO2emissions through GPP. Theaverage CO2emissions impact varies from -9% inGermany to -49% in the Netherlands. Three out of theseven countries (i.e. The Netherlands, Sweden and theUnited Kingdom) have a large CO2impact of around-40% or higher. In the other four countries, the CO2impact of GPP is a bit lower at around -13%.It should be noted that the 25% CO2impact could beeither higher or lower if a full Life Cycle Analyses wouldbe applied and if CO2equivalents would be included inthe calculation as well. Also by taking into account otherenvironmental impacts besides CO2(e.g. reductions inair, soil and water pollution or waste generation), GPP willlead to even more environmental benefits than just 25%CO2reductions.
7.3
Financial benefits through GPP
In contrast to common perception, this study shows thatGPP can lead to decreases in costs for the purchasingorganisation instead of increases. When using a LifeCycle Costing (LCC) approach in calculating the financialimpact of GPP, the outcome is that with an average levelof GPP of 45% (indicator 1), the average financial impactof GPP is -1%.This means that although the use of environmentalcriteria in procurement procedures can lead to higherdirect purchasing costs, it can result into an averagedecrease of indirect costs for public organisations ofaround 1%. The reason behind this is that higherpurchasing prices of green goods are compensated bylower operating costs. This is something to take intoaccount when evaluating proposals on costs. Up to nowour study shows that methods for LCC are not yet fullyincorporated into the procurement process. Proposalsare more often evaluated on purchasing costs only.
7.2
CO2benefits through GPP
One of the main objectives of Green Public Procurementis to have a positive impact on the environment by buyinggreen. Our respondents indicated that the two mostdecisive arguments for choosing green during the
Collection of statistical information on Green Public Procurement in the EU
69
From our financial impact analysis we can conclude thatthere are mainly two product groups leading to costreductions through GPP: construction and transport. Thisexplains the differences on a country level, with figuresvarying from a cost decrease of 5,70% in the UnitedKingdom to a cost increase of 0,31 in Denmark. TheUnited Kingdom has a high level of GPP on greenconstruction while Denmark has a low level of GreenProcurement on both construction and transport.
both impacts is the same, we can determine whichproduct group leads to both CO2emission reduction andcost reduction per functional unit, and whether this isoptimal for core or comprehensive levels of GPP. Theresult of the combination is shown in the figure below.On the horizontal axis, we show the financial impact ofGPP, while on the vertical axis, we show the CO2impactof GPP ranging from 0% to -100%, both per functionalunit. The size of a bubble indicates the average relativeCO2emissions of a product group. The figure should beinterpreted as follows: product groups that are placed onthe upper right on the graph, have both a negative CO2and financial impact, and thus can be favourable forpublic purchasers. On the other hand, product groupswhich are on the lower left side of the graph, have a smallnegative impact in terms of CO2emissions and a positivefinancial impact (i.e. increases in costs).From the figure, we conclude that only for transport,construction and comprehensive green cleaning services,both the CO2impact and the financial impact arenegative. These are the product groups that publicpurchasers could focus on when implementing GPP.However, when also taking into account the productgroup that have the relatively higher CO2emissions(displayed by the size of the bubbles), construction andelectricity are the product groups to focus on.
7.4
Comparison between CO2impact andfinancial impact
Combining the results of indicators 3 and 4, we concludethat in 2006/2007, Green Public Procurement in theGreen-7 has led to average CO2reductions of 25% andaverage life cycle cost reductions of around 1%. Bothresults are very encouraging. It means that publicpurchasers have the possibility to substantially reduceCO2emissions, without this leading to extra costs ofownership. Although direct purchasing costs aregenerally increased by GPP, this can be compensated byreductions in operational costs in the long term.On a product group level, we can make the followingcomparisons between the CO2impact and financialimpact. Since the functional unit used for determining
Figure 7.1: CO2impact and financial impact of GPP per functional unit. Negative numbers imply lower CO2emissions or lowercosts and positive number imply higher costs.electricitycleaningpapergardeningpaperclothingconstruction-80%-100%-120%
-60%
electricityoffice IT
-40%
-20%transportcatering25%20%15%10%5%cleaning0%-5%-10%0%-15%
Core greenComprehensive green
financial impact of GPP per functional unit
70
PricewaterhouseCoopers
CO2impact of GPP per functional unit
7.5
Reflection and recommendations onthe methodology applied
Overall, we have found that the use of the questionnaireand sampling has proven to be an adequate tool formeasuring the levels and impact of Green PublicProcurement in a country. With limited resources we havebeen able to reach a broad and representative samplepopulation that has provided us with the necessary datafor this study and allowed us to do statistically soundstatements. The methodology applied is practical, flexibleand can be applied to assess the level and impact ofGPP in all European Members States.However, there are certain aspects that are important tonote when performing a comparable study:lRespondents indicated that filling in a questionnairecan be very time-consuming. When designing aquestionnaire, the number of manual processes forpurchases should be as little as possible. Forexample, instead of asking every criterion in aseparate question, one could opt for the possibility tomark criteria in a list of criteria.lConcerning the difference between indicators 1 and2, it was found that the precision levels of indicator 2are higher than indicator 1. When taking into accountprocurement values for the calculation of indicator 1,the spreading of the data increases, which results inlower levels of precision.lAs is stated in the introduction, the future monitoringwill be based on compliance with all core criteria ofthe GPP training toolkit. Therefore, all core criteria(rather than merely a selection of criteria) should beincluded in a survey for the monitoring of the level ofGPP in a country.lIn order to reach a high response rate, it is essentialto have an up-to-date contact list of purchasers ofpublic organisation. Time should be invested to makethe list of contacts as accurate as possible, beforesending out the questionnaire.lPublic procurement is not applied in the same way forevery country. For example, Finland and Austria havecentral purchasing organisations that do a lot ofpurchasing for many organisations. It isrecommended that when performing a comparablestudy, the first step should be to look into publicprocurement of the country under scope and toidentify the most suitable method for approachingpotential respondents.
Collection of statistical information on Green Public Procurement in the EU
71
Appendix
A Response rates per product group
Response rates per product group per country based on the number of contracts.AustriaCleaningConstructionElectricityCateringGardeningOffice ITPaperClothingTransportFurnitureMean4320221811312911202223Denmark351932257373216143025Finland4824351410373218232827Germany3211221010242714252420TheNetherlands92381105043568029444258Sweden805569915716938525952UnitedKingdom2121301513221611171418Total351188320141109278285137195219222
Collection of statistical information on Green Public Procurement in the EU
73
B Precision levels per country
The levels of GPP that were calculated are based on asample population are therefore only best estimates ofthe levels of GPP. In this Appendix, we present detailedresults of the precision levels that relate to these levels ofGPP. Both for core and comprehensive levels and forindicator 1 and indicator 2, precision levels arecalculated. The precision level of a certain indicator for acertain level of GPP is a measure of the uncertainty of thebest estimates of the levels of GPP. For example, aprecision level of 14% for core green purchases inAustria (indicator 2), means that it is highly likely (our levelof confidence was set at 95%) that the calculated level ofGPP (i.e. the best estimate) and the actual level of GPPdiffer no more than 14%, which may include upper andlower bounds. The figures show that on average, theprecision levels of indicator 1 are larger (i.e. largeruncertainty) than the precision levels of indicator 2. Thisis a result of the large differences in procurement valuesbetween organisations that are used to calculate thelevels of GPPPrecision levels (core plus comprehensive)indicator 1AustriaDenmarkFinlandGermanyNetherlandsSwedenUnited Kingdom51,3%17,1%28,0%28,5%14,3%12,3%26,8%indicator 213,6%11,9%8,9%16,5%8,4%8,8%13,2%
FinlandCoreIndicator 1Indicator 229%9%
Precision levelsComprehensive8%6%
GermanyCoreIndicator 1Indicator 227%16%
Precision levelsComprehensive3%12%
The NetherlandsCoreIndicator 1Indicator 211%7%
Precision levelsComprehensive7%7%
SwedenCoreIndicator 1Indicator 29%9%
Precision levelsComprehensive9%7%
United KingdomCoreIndicator 1Indicator 234%13%
Precision levelsComprehensive52%9%
AustriaCoreIndicator 1Indicator 253%14%
Precision levelsComprehensive4%10%
DenmarkCoreIndicator 1Indicator 216%11%
Precision levelsComprehensive7%9%
74
PricewaterhouseCoopers
C Data sheets on organising GPP
This Appendix contains data sheets on the way respondents have said to organise Green Public Procurement withintheir organisation. The main results were presented in chapter 2. In this Appendix, some background results arepresented and the breakdown to central and non-central governmental organisations.
C1
Procurement policy
To what extent does your organisation have a centrally organised procurement function?TotalCompletelycentralised10%21%8%14%7%18%5%Mostly centralised,some decentralised37%43%42%57%25%46%33%Just as muchcentralised asdecentralised36%12%27%19%17%13%6%Mostlydecentralised, somecentralised11%21%16%8%39%20%50%Completelydecentralised6%3%7%3%13%3%5%
AustriaDenmarkFinlandGermanyThe NetherlandsSwedenUnited Kingdom
Central
Completelycentralised12%10%6%8%13%19%0%
Mostly centralised,some decentralised53%25%47%69%41%42%75%
Just as muchcentralised asdecentralised24%30%24%15%25%16%0%
Mostlydecentralised, somecentralised6%30%21%8%16%22%25%
Completelydecentralised6%5%3%0%6%1%0%
AustriaDenmarkFinlandGermanyThe NetherlandsSwedenUnited Kingdom
Non-central
Completelycentralised9%22%8%14%6%18%5%
Mostly centralised,some decentralised37%45%42%56%22%47%31%
Just as muchcentralised asdecentralised36%10%27%19%16%13%7%
Mostlydecentralised, somecentralised12%20%16%8%42%20%52%
Completelydecentralised6%3%7%3%14%3%5%
AustriaDenmarkFinlandGermanyThe NetherlandsSwedenUnited Kingdom
Collection of statistical information on Green Public Procurement in the EU
75
C2
Implementation of Green Public Procurement
On which organisational level have the environmental goals been established (multiple options possible)?TotalRepresentative body(e.g. Parliament,Municipal Council)73%89%81%83%74%50%79%Board level of theorganisation (e.g.Minister, MunicipalExecutive, etc.)61%49%77%78%59%90%68%Directorate ormanagement levelOther
AustriaDenmarkFinlandGermanyThe NetherlandsSwedenUnited Kingdom
76%70%74%100%73%67%55%
87%92%84%66%87%96%89%
Central
Representative body(e.g. Parliament,Municipal Council)78%74%74%76%90%87%100%
Board level of theorganisation (e.g.Minister, MunicipalExecutive, etc.)44%95%71%71%37%98%67%
Directorate ormanagement level
Other
AustriaDenmarkFinlandGermanyThe NetherlandsSwedenUnited Kingdom
89%84%74%94%67%36%100%
89%74%94%88%87%83%100%
Non-central
Representative body(e.g. Parliament,Municipal Council)72%90%81%83%71%45%77%
Board level of theorganisation (e.g.Minister, MunicipalExecutive, etc.)61%44%77%78%63%89%68%
Directorate ormanagement level
Other
AustriaDenmarkFinlandGermanyThe NetherlandsSwedenUnited Kingdom
76%69%74%100%74%71%52%
87%93%83%65%87%98%88%
76
PricewaterhouseCoopers
Who is/are responsible for meeting goals set for greening procurement?CentralManagement / directorate Middle management (e.g.procurement coordinator,of organisation (e.g.procurement department)minister, municipalexecutive)22%17%17%33%36%28%10%56%67%33%0%44%46%66%ProcurersOther / unknown
AustriaDenmarkFinlandGermanyThe NetherlandsSwedenUnited Kingdom
0%0%33%17%4%21%7%
22%17%17%50%16%5%18%
Decentral
Management / directorate Middle management (e.g.procurement coordinator,of organisation (e.g.procurement department)minister, municipalexecutive)50%6%20%36%20%19%10%23%78%41%8%30%46%66%
Procurers
Other / unknown
AustriaDenmarkFinlandGermanyThe NetherlandsSwedenUnited Kingdom
9%0%17%24%11%25%7%
18%17%22%32%39%10%18%
What has been done to empower the responsible people to meet the green procurement goals?CentralTraining and educationof procurement officersin the field of greenprocurementActive communicationtowards theorganisation about setgoals in makingprocurement moresustainable39%26%17%6%55%18%33%Formallyappointed powersto the responsibleofficersPolitical supportOther
AustriaDenmarkFinlandGermanyThe NetherlandsSwedenUnited Kingdom
28%16%10%13%34%28%33%
22%21%14%19%14%13%17%
6%21%7%0%17%3%0%
6%16%21%6%21%26%0%
Collection of statistical information on Green Public Procurement in the EU
77
Non-central
Training andeducation ofprocurement officersin the field of greenprocurement
Activecommunicationtowards theorganisation aboutset goals in makingprocurement moresustainable22%33%15%21%32%22%50%
Formally appointedpowers to theresponsible officers
Political support
Other
AustriaDenmarkFinlandGermanyThe NetherlandsSwedenUnited Kingdom
8%30%17%9%22%41%58%
24%13%12%25%15%13%8%
6%16%2%7%11%18%26%
12%10%15%4%29%15%14%
Which external sources are being used to find information about green procurement (for example on green criteria)?CentralEuropeanCommission GPPwebsite35%32%24%13%7%7%33%Procura+ websiteEcolabelCountry specificsources18%21%3%6%14%21%17%35%84%31%50%62%43%33%Other
AustriaDenmarkFinlandGermanyThe NetherlandsSwedenUnited Kingdom
12%11%0%13%0%42%0%
18%32%14%0%28%20%17%
Non-central
EuropeanCommission GPPwebsite8%23%18%18%9%15%22%
Procura+ website
Ecolabel
Country specificsources5%34%5%5%15%41%24%21%70%15%33%80%70%69%
Other
AustriaDenmarkFinlandGermanyThe NetherlandsSwedenUnited Kingdom
4%2%7%4%4%32%15%
23%30%15%8%17%17%42%
How does your organisation keep the level of knowledge and information on green procurement up to date?
78
PricewaterhouseCoopers
Central
Training andeducation
Seminars
By cooperating withother(governmental)organisations18%32%17%19%38%29%33%41%58%17%31%66%28%17%
Internet
Other
AustriaDenmarkFinlandGermanyThe NetherlandsSwedenUnited Kingdom
29%21%34%13%24%20%33%
35%32%14%6%34%19%0%
6%37%17%13%10%12%0%
Non-central
Training andeducation
Seminars
By cooperating withother(governmental)organisations13%38%21%7%43%60%50%21%54%27%25%36%42%43%
Internet
Other
AustriaDenmarkFinlandGermanyThe NetherlandsSwedenUnited Kingdom
10%8%27%12%18%36%51%
8%43%18%20%54%34%31%
14%16%11%7%16%5%11%
Does your organisation cooperate with other (governmental) organisations in the field of green procurement?CentralAustriaDenmarkFinlandGermanyThe NetherlandsSwedenUnited Kingdom55%53%77%78%15%78%0%Non-central82%44%65%91%54%56%33%Total82%45%66%91%49%59%31%
Collection of statistical information on Green Public Procurement in the EU
79
During the procurement process, are environmental aspects compared with price and other criteria?CentralAustriaDenmarkFinlandGermanyThe NetherlandsSwedenUnited KingdomYes, always42%22%4%0%20%4%0%Yes, most of the time25%39%9%36%32%21%50%Yes, sometimes0%33%52%27%28%41%50%Seldom17%6%35%27%12%29%0%Never17%0%0%9%8%5%0%
Non-centralAustriaDenmarkFinlandGermanyThe NetherlandsSwedenUnited Kingdom
Yes, always4%17%7%18%13%3%26%
Yes, most of the time39%41%18%29%34%35%26%
Yes, sometimes35%37%29%38%37%43%34%
Seldom16%6%40%13%13%16%7%
Never5%0%6%2%3%3%7%
Are proposals being evaluated on Life Cycle Costing or on the procurement costs of the product/service only?CentralAustriaDenmarkFinlandGermanyThe NetherlandsSwedenUnited KingdomMostly evaluation onLCC25%22%22%11%8%5%0%Sometimes evaluation on LCC, sometimesevaluation on purchasing costs42%56%43%44%54%29%100%Mostly evaluation on purchasing costs33%22%35%44%38%66%0%
Non-centralAustriaDenmarkFinlandGermanyThe NetherlandsSwedenUnited Kingdom
Mostly evaluation onLCC8%11%14%14%12%7%28%
Sometimes evaluation on LCC, sometimesevaluation on purchasing costs47%57%38%49%38%31%55%
Mostly evaluation on purchasing costs45%32%49%37%51%62%17%
80
PricewaterhouseCoopers
Which criteria are decisive for asking for “green” goods (by including green criteria as minimum technical specificationsor as award criteria)?CentralVolume ofthe tender,only thelargertendersVolume ofthe tender,only thesmallertendersEnvironmen Availabilityof greental impactalternativesof thepurchaseFamiliaritywith greenalternativesFamiliarity The impact of thegreen alternativewithon the processessuppliersof thethat offerorganisation -greengoods/servi only choosing forthe greencesalternative whenimpact is minimal24%26%14%6%28%31%17%6%0%3%13%10%6%0%Other
AustriaDenmarkFinlandGermanyThe NetherlandsSwedenUnited Kingdom
0%21%0%6%14%1%0%
0%5%0%13%0%0%0%
29%53%45%13%38%50%33%
41%37%38%38%59%44%17%
24%53%31%13%38%32%0%
12%11%10%0%10%2%0%
Non-central
Volume ofthe tender,only thelargertenders
Volume ofthe tender,only thesmallertenders
Environmen Availabilityof greental impactalternativesof thepurchase
Familiaritywith greenalternatives
Familiarity The impact of thegreen alternativewithon the processessuppliersof thethat offerorganisation -greengoods/servi only choosing forthe greencesalternative whenimpact is minimal18%31%14%11%22%19%15%9%3%3%9%21%6%9%
Other
AustriaDenmarkFinlandGermanyThe NetherlandsSwedenUnited Kingdom
7%16%5%5%7%3%12%
2%5%1%1%2%3%4%
19%48%36%26%45%54%51%
45%41%28%28%52%59%47%
22%36%28%20%42%40%19%
7%11%8%3%13%6%4%
Collection of statistical information on Green Public Procurement in the EU
81
D Data sheet on the levels of GPP
In all seven countries there are more non-central government organisations than central government organisations. Thepercentages in D1 and D2 have been adjusted for the central/non-central ratio. The percentages in D3 and D4 have notbeen adjusted.
D2
Results of GPP scores for indicator 1 per country in percentagesCore level4%36%96%25%0%42%12%6%1%100%49%3%0%0%88%23%Compreh. level4%0%2%Non-green92%64%2%75%100%58%0%71%99%0%48%FinlandCleaningConstructionElectricityCateringGardeningOffice ITPaperClothingTransportFurnitureWeighted averageCore level10%22%24%3%0%62%2%56%34%53%35%8%0%0%31%0%Compreh. level66%0%15%Non-green24%78%61%97%100%38%67%44%66%47%57%
AustriaCleaningConstructionElectricityCateringGardeningOffice ITPaperClothingTransportFurnitureWeighted average
DenmarkCleaningConstructionElectricityCateringGardeningOffice ITPaperClothingTransportFurnitureWeighted average
Core level53%2%77%25%92%67%0%73%10%67%30%
Compreh. level40%9%0%
Non-green7%89%23%75%
GermanyCleaningConstructionElectricityCateringGardeningOffice ITPaperClothingTransportFurnitureWeighted average
Core level31%5%45%94%0%77%0%31%67%89%27%
Compreh. level11%0%0%
Non-green58%95%55%6%
0%19%91%4%
8%14%9%23%90%33%
0%18%42%0%
100%4%58%69%33%11%
12%
58%
3%
70%
82
PricewaterhouseCoopers
NetherlandsCleaningConstructionElectricityCateringGardeningOffice ITPaperClothingTransportFurnitureWeighted average
Core level16%10%43%28%0%67%9%53%8%73%18%
Compreh. level39%0%37%
Non-green45%90%20%72%
United KingdomCleaningConstructionElectricityCateringGardeningOffice ITPaperClothingTransportFurnitureWeighted average
Core level12%29%57%63%0%75%11%4%55%100%33%
Compreh. level36%49%2%
Non-green52%23%41%37%
6%0%66%1%
94%33%25%45%92%27%
61%0%63%0%
39%25%27%96%45%0%
8%
73%
41%
25%
SwedenCleaningConstructionElectricityCateringGardeningOffice ITPaperClothingTransportFurnitureWeighted average
Core level9%21%33%10%6%79%4%19%40%75%28%
Compreh. level72%12%43%
Non-green19%68%24%90%
0%11%73%1%
94%10%23%80%60%25%
22%
51%
Collection of statistical information on Green Public Procurement in the EU
83
D2
Results of GPP scores for indicator 2 per country in percentages
AustriaCleaningConstructionElectricityCateringGardeningOffice ITPaperClothingTransportFurnitureWeighted average
Core level4%36%96%25%0%42%12%6%1%100%49%
Compreh. level4%0%2%
Non-green92%64%2%75%
FinlandCleaningConstructionElectricityCateringGardeningOffice ITPaperClothingTransportFurnitureWeighted average
Core level10%22%24%3%0%62%2%56%34%53%35%
Compreh. level66%0%15%
Non-green24%78%61%97%
0%0%88%23%
100%58%0%71%99%0%
0%0%31%0%
100%38%67%44%66%47%
3%
48%
8%
57%
DenmarkCleaningConstructionElectricityCateringGardeningOffice ITPaperClothingTransportFurnitureWeighted average
Core level53%2%77%25%92%67%0%73%10%67%30%
Compreh. level40%9%0%
Non-green7%89%23%75%
GermanyCleaningConstructionElectricityCateringGardeningOffice ITPaperClothingTransportFurnitureWeighted average
Core level31%5%45%94%0%77%0%31%67%89%27%
Compreh. level11%0%0%
Non-green58%95%55%6%
0%19%91%4%
8%14%9%23%90%33%
0%18%42%0%
100%4%58%69%33%11%
12%
58%
3%
70%
84
PricewaterhouseCoopers
NetherlandsCleaningConstructionElectricityCateringGardeningOffice ITPaperClothingTransportFurnitureWeighted average
Core level16%10%43%28%0%67%9%53%8%73%18%
Compreh. level39%0%37%
Non-green45%90%20%72%
United KingdomCleaningConstructionElectricityCateringGardeningOffice ITPaperClothingTransportFurnitureWeighted average
Core level12%29%57%63%0%75%11%4%55%100%33%
Compreh. level36%49%2%
Non-green52%23%41%37%
6%0%66%1%
94%33%25%45%92%27%
61%0%63%0%
39%25%27%96%45%0%
8%
73%
41%
25%
SwedenCleaningConstructionElectricityCateringGardeningOffice ITPaperClothingTransportFurnitureWeighted average
Core level9%21%33%10%6%79%4%19%40%75%28%
Compreh. level72%12%43%
Non-green19%68%24%90%
0%11%73%1%
94%10%23%80%60%25%
22%
51%
Collection of statistical information on Green Public Procurement in the EU
85
D3
Results for central and non-central organisations on indicator 1Core levelCentral governmentNon-central governmentCentral governmentNon-central governmentCentral governmentNon-central governmentCentral governmentNon-central governmentCentral governmentNon-central governmentCentral governmentNon-central governmentCentral governmentNon-central governmentCentral governmentNon-central governmentCentral governmentNon-central governmentCentral governmentNon-central government98%2%0%37%11%98%100%24%0%0%100%41%6%12%1%6%1%1%100%100%Comprehensive level2%4%0%0%0%2%--0%0%0%0%94%87%99%22%----Non-green0%94%100%63%89%0%0%76%0%100%0%59%0%0%0%72%99%99%0%0%
AustriaCleaningConstructionElectricityCateringGardeningOffice ITPaperClothingTransportFurniture
DenmarkCleaningConstructionElectricityCateringGardeningOffice ITPaperClothingTransportFurnitureCentral governmentNon-central governmentCentral governmentNon-central governmentCentral governmentNon-central governmentCentral governmentNon-central governmentCentral governmentNon-central governmentCentral governmentNon-central governmentCentral governmentNon-central governmentCentral governmentNon-central governmentCentral governmentNon-central governmentCentral governmentNon-central government
Core level98%48%0%2%99%75%89%19%0%92%56%68%0%0%28%78%0%10%75%66%
Comprehensive level2%44%100%0%0%0%--0%0%24%18%99%90%0%4%----
Non-green0%7%0%98%1%25%11%81%0%8%20%13%1%10%72%18%0%90%25%34%
86
PricewaterhouseCoopers
FinlandCleaningConstructionElectricityCateringGardeningOffice ITPaperClothingTransportFurnitureCentral governmentNon-central governmentCentral governmentNon-central governmentCentral governmentNon-central governmentCentral governmentNon-central governmentCentral governmentNon-central governmentCentral governmentNon-central governmentCentral governmentNon-central governmentCentral governmentNon-central governmentCentral governmentNon-central governmentCentral governmentNon-central government
Core level8%10%0%23%94%21%0%3%0%0%85%61%43%0%0%59%21%34%62%52%
Comprehensive level11%68%0%0%0%15%--0%0%0%0%0%32%0%0%----
Non-green81%22%100%77%6%63%100%97%100%100%15%39%57%68%100%41%79%66%38%48%
GermanyCleaningConstructionElectricityCateringGardeningOffice ITPaperClothingTransportFurnitureCentral governmentNon-central governmentCentral governmentNon-central governmentCentral governmentNon-central governmentCentral governmentNon-central governmentCentral governmentNon-central governmentCentral governmentNon-central governmentCentral governmentNon-central governmentCentral governmentNon-central governmentCentral governmentNon-central governmentCentral governmentNon-central government
Core level0%32%0%5%30%46%0%96%0%0%42%78%0%0%16%31%0%68%26%90%
Comprehensive level0%11%0%0%0%0%--0%0%0%19%95%41%0%0%----
Non-green100%57%100%95%70%54%100%4%100%100%58%3%5%59%84%69%100%32%74%10%
Collection of statistical information on Green Public Procurement in the EU
87
NetherlandsCleaningConstructionElectricityCateringGardeningOffice ITPaperClothingTransportFurnitureCentral governmentNon-central governmentCentral governmentNon-central governmentCentral governmentNon-central governmentCentral governmentNon-central governmentCentral governmentNon-central governmentCentral governmentNon-central governmentCentral governmentNon-central governmentCentral governmentNon-central governmentCentral governmentNon-central governmentCentral governmentNon-central government
Core level0%19%8%10%93%34%31%27%0%0%66%67%2%10%6%61%5%9%29%80%
Comprehensive level72%33%0%0%4%43%--0%7%0%0%87%63%0%2%----
Non-green28%48%92%90%4%23%69%73%100%93%34%33%11%27%94%37%95%91%71%20%
SwedenCleaningConstructionElectricityCateringGardeningOffice ITPaperClothingTransportFurnitureCentral governmentNon-central governmentCentral governmentNon-central governmentCentral governmentNon-central governmentCentral governmentNon-central governmentCentral governmentNon-central governmentCentral governmentNon-central governmentCentral governmentNon-central governmentCentral governmentNon-central governmentCentral governmentNon-central governmentCentral governmentNon-central government
Core level6%10%100%10%40%32%8%10%0%6%82%79%0%5%0%21%52%38%92%73%
Comprehensive level79%71%0%13%2%49%--0%0%0%12%73%73%0%1%----
Non-green15%19%0%77%59%20%92%90%100%94%18%9%27%22%100%77%48%62%8%27%
88
PricewaterhouseCoopers
United KingdomCleaningConstructionElectricityCateringGardeningOffice ITPaperClothingTransportFurnitureCentral governmentNon-central governmentCentral governmentNon-central governmentCentral governmentNon-central governmentCentral governmentNon-central governmentCentral governmentNon-central governmentCentral governmentNon-central governmentCentral governmentNon-central governmentCentral governmentNon-central governmentCentral governmentNon-central governmentCentral governmentNon-central government
Core level0%12%0%29%100%54%0%63%0%0%100%73%0%11%0%4%0%55%100%100%
Comprehensive level0%36%0%49%0%2%--0%61%0%0%0%63%0%0%----
Non-green0%52%0%23%0%44%0%37%0%39%0%27%0%27%0%96%0%45%0%0%
Collection of statistical information on Green Public Procurement in the EU
89
D4. Results for central and non-central organisations on indicator 2AustriaCleaningConstructionElectricityCateringGardeningOffice ITPaperClothingTransportFurnitureCentral governmentNon-central governmentCentral governmentNon-central governmentCentral governmentNon-central governmentCentral governmentNon-central governmentCentral governmentNon-central governmentCentral governmentNon-central governmentCentral governmentNon-central governmentCentral governmentNon-central governmentCentral governmentNon-central governmentCentral governmentNon-central governmentCore level17%14%0%13%67%38%100%44%0%0%100%76%33%29%50%43%60%77%100%95%Comprehensive level33%11%0%0%0%54%--0%0%0%0%67%64%50%14%----Non-green50%76%100%88%33%8%0%56%0%100%0%24%0%7%0%43%40%23%0%5%
DenmarkCleaningConstructionElectricityCateringGardeningOffice ITPaperClothingTransportFurnitureCentral governmentNon-central governmentCentral governmentNon-central governmentCentral governmentNon-central governmentCentral governmentNon-central governmentCentral governmentNon-central governmentCentral governmentNon-central governmentCentral governmentNon-central governmentCentral governmentNon-central governmentCentral governmentNon-central governmentCentral governmentNon-central government
Core level94%35%50%4%90%51%93%33%0%40%45%76%0%0%15%43%0%27%56%82%
Comprehensive level6%35%50%4%0%5%--0%0%24%3%81%27%0%36%----
Non-green0%29%0%92%10%44%7%67%0%60%30%21%19%73%85%21%100%73%44%18%
90
PricewaterhouseCoopers
FinlandCleaningConstructionElectricityCateringGardeningOffice ITPaperClothingTransportFurnitureCentral governmentNon-central governmentCentral governmentNon-central governmentCentral governmentNon-central governmentCentral governmentNon-central governmentCentral governmentNon-central governmentCentral governmentNon-central governmentCentral governmentNon-central governmentCentral governmentNon-central governmentCentral governmentNon-central governmentCentral governmentNon-central government
Core level13%31%0%18%67%56%0%4%0%0%67%79%25%2%0%8%33%33%60%91%
Comprehensive level38%48%0%0%0%3%--0%0%0%0%0%34%0%0%----
Non-green50%21%100%82%33%41%100%96%100%100%33%21%75%64%100%92%67%67%40%9%
GermanyCleaningConstructionElectricityCateringGardeningOffice ITPaperClothingTransportFurnitureCentral governmentNon-central governmentCentral governmentNon-central governmentCentral governmentNon-central governmentCentral governmentNon-central governmentCentral governmentNon-central governmentCentral governmentNon-central governmentCentral governmentNon-central governmentCentral governmentNon-central governmentCentral governmentNon-central governmentCentral governmentNon-central government
Core level17%23%0%14%50%26%0%38%0%0%83%74%0%0%33%30%0%29%25%68%
Comprehensive level0%15%0%0%0%0%--0%0%0%16%80%63%0%0%----
Non-green83%62%100%86%50%74%100%63%100%100%17%11%20%38%67%70%100%71%75%32%
Collection of statistical information on Green Public Procurement in the EU
91
NetherlandsCleaningConstructionElectricityCateringGardeningOffice ITPaperClothingTransportFurnitureCentral governmentNon-central governmentCentral governmentNon-central governmentCentral governmentNon-central governmentCentral governmentNon-central governmentCentral governmentNon-central governmentCentral governmentNon-central governmentCentral governmentNon-central governmentCentral governmentNon-central governmentCentral governmentNon-central governmentCentral governmentNon-central government
Core level0%22%25%12%50%26%40%20%0%0%67%57%17%10%50%32%53%21%42%54%
Comprehensive level63%25%0%4%0%0%--0%3%0%0%50%64%0%5%----
Non-green38%52%75%85%50%74%60%80%100%97%33%43%33%26%50%63%47%79%58%46%
SwedenCleaningConstructionElectricityCateringGardeningOffice ITPaperClothingTransportFurnitureCentral governmentNon-central governmentCentral governmentNon-central governmentCentral governmentNon-central governmentCentral governmentNon-central governmentCentral governmentNon-central governmentCentral governmentNon-central governmentCentral governmentNon-central governmentCentral governmentNon-central governmentCentral governmentNon-central governmentCentral governmentNon-central government
Core level17%24%100%13%53%32%33%40%0%30%52%75%0%11%0%39%25%42%67%69%
Comprehensive level58%45%0%21%7%37%--0%0%0%7%61%60%50%3%----
Non-green25%31%0%67%40%31%67%60%100%70%48%18%39%29%50%58%75%58%33%31%
92
PricewaterhouseCoopers
United KingdomCleaningConstructionElectricityCateringGardeningOffice ITPaperClothingTransportFurnitureCentral governmentNon-central governmentCentral governmentNon-central governmentCentral governmentNon-central governmentCentral governmentNon-central governmentCentral governmentNon-central governmentCentral governmentNon-central governmentCentral governmentNon-central governmentCentral governmentNon-central governmentCentral governmentNon-central governmentCentral governmentNon-central government
Core level0%19%100%43%100%67%0%55%0%8%100%73%0%13%0%11%0%21%100%89%
Comprehensive level0%48%0%9%0%3%--0%17%0%0%0%67%0%0%----
Non-green0%33%0%48%0%30%100%45%0%75%0%27%0%20%0%89%100%79%0%11%
Collection of statistical information on Green Public Procurement in the EU
93
E Data sheets on the CO2impact of GPP
Detailed data concerning the CO2impact of GPP for the seven countries under scope are provided in this section. Perproduct group, we divided the total CO2impact into the CO2impact from core criteria and the CO2impact fromcomprehensive criteria. The sum of the two is equal to the total CO2impact. Also the weighted averages and theweighting factors are provided.It must be noted that no results are shown for the product group furniture, since it was found that reliable CO2data wasnot available concerning the criteria included in the questionnaire. Negative numbers imply reductions in CO2emissions.AustriaCleaning servicesConstructionElectricityCatering & foodGardeningOffice IT equipmentPaperTextilesTransportweighted averagetotal CO2impact-4%-25%-2%0%0%-10%-90%-21%0%-11%core0%-25%0%0%0%-10%-12%-4%0%-5%comprehensive-4%0%-2%-0%0%-78%-17%--6%relative CO2emissions0%19%75%0%0%0%5%0%1%
DenmarkCleaning servicesConstructionElectricityCatering & foodGardeningOffice IT equipmentPaperTextilesTransportweighted average
total CO2impact-43%-8%-20%0%-92%-18%-8%-50%-1%-15%
core0%-1%-20%0%-92%-18%-8%-50%-1%-13%
comprehensive-43%-6%0%-0%-1%0%0%--2%
relative CO2emissions0%32%59%0%0%0%8%0%0%
94
PricewaterhouseCoopers
FinlandCleaning servicesConstructionElectricityCatering & foodGardeningOffice IT equipmentPaperTextilesTransportweighted average
total CO2impact-68%-15%-19%0%0%-15%-26%-41%-4%-18%
core0%-15%-5%0%0%-15%-2%-41%-4%-10%
comprehensive-68%0%-14%-0%0%-24%0%--8%
relative CO2emissions0%47%47%0%0%0%6%0%0%
GermanyCleaning servicesConstructionElectricityCatering & foodGardeningOffice IT equipmentPaperTextilesTransportweighted average
total CO2impact-12%-4%-18%0%0%-23%-33%-23%-8%-9%
core0%-4%-18%0%0%-19%0%-23%-8%-8%
comprehensive-12%0%0%-0%-4%-33%0%--1%
relative CO2emissions0%64%31%0%0%0%4%0%0%
NetherlandsCleaning servicesConstructionElectricityCatering & foodGardeningOffice IT equipmentPaperTextilesTransportweighted average
total CO2impact-41%-7%-56%0%-6%-16%-65%-40%-1%-47%
core0%-7%-19%0%0%-16%-8%-39%-1%-17%
comprehensive-41%0%-37%--6%0%-56%-1%--30%
relative CO2emissions0%19%78%0%0%0%3%0%0%
Collection of statistical information on Green Public Procurement in the EU
95
SwedenCleaning servicesConstructionElectricityCatering & foodGardeningOffice IT equipmentPaperTextilesTransportweighted average
total CO2impact-74%-21%-44%0%-6%-22%-66%-14%-5%-39%
core0%-13%-2%0%-6%-19%-4%-13%-5%-7%
comprehensive-74%-8%-43%-0%-3%-62%-1%--32%
relative CO2emissions0%44%30%0%0%0%25%0%1%
United KingdomCleaning servicesConstructionElectricityCatering & foodGardeningOffice IT equipmentPaperTextilesTransportweighted average
total CO2impact-38%-55%-27%0%-61%-18%-63%-3%-7%-38%
core0%-20%-25%0%0%-18%-10%-3%-7%-23%
comprehensive-38%-35%-2%--60%0%-53%0%--15%
relative CO2emissions0%36%62%0%0%0%2%0%0%
96
PricewaterhouseCoopers
F
Data sheets on the financial impact of GPP
Detailed data concerning the financial impact of GPP forthe seven countries under scope are provided in thissection. Per product group, we divide the total financialimpact into the financial impact from core criteria and thefinancial impact from comprehensive criteria. The sum ofthe two is equal to the total financial impact.Furthermore, for the relevant elements in the user lifecycle of a product that are influenced by GPP from a costperspective, we have determined the financial impact aswell. In order to calculate the total impact, the financialimpacts per element must be weighted using the coststructure of the product group. Please refer to theseparate report on methodologies for details.It must be noted that no results are shown for theproduct group furniture, since it was found that noreliable financial data was available concerning thecriteria asked in the questionnaire. Negative numbersimply cost reductions and positive numbers implyincreases in costs.
F1
Overall resultsfinancialimpact-1,20%-5,70%-1,24%-0,79%-0,48%-0,32%-0,17%0,31%core-0,60%-2,05%-0,72%-0,32%-0,66%-0,35%-0,41%0,33%compre-hensive-0,60%-3,65%-0,52%-0,47%0,18%0,03%0,25%-0,02%
countryGreen-7 averageUnited KingdomSwedenFinlandAustriaGermanyNetherlandsDenmark
Collection of statistical information on Green Public Procurement in the EU
97
F2
Austria
Financial impact from core and comprehensive levels of GPPAustriaCleaning servicesConstructionElectricityCatering & foodGardeningOffice IT equipmentPaperTextilesTransportweighted averagetotal financial impact-0,38%-3,83%0,03%0,49%0,00%0,37%18,47%2,08%-0,04%-0,48%core0,02%-3,83%0,00%0,49%0,00%0,37%1,90%0,42%-0,04%-0,66%comprehensive-0,41%0,00%0,03%-0,00%0,00%16,57%1,66%-0,18%relative procurement value12%20%31%0%0%24%1%2%9%
Financial impact on cost elementsAustriaCleaning serviceslabour costscleaning productsConstructioninvestment costcosts for heatingcosts for electricity usecosts for water useElectricitypurchase priceCatering & foodprocurement of foodGardeningmachinery costssoil improversOffice IT equipmentpurchase priceelectricity usePaperpurchase priceTextilespurchase priceTransportroad taxfuel costsfinancial impact-0,38%-0,45%2,05%-3,83%0,65%-22,24%-26,90%-10,76%0,03%0,03%0,49%1,03%0,00%0,00%0,00%0,37%0,83%-6,22%18,47%18,47%2,08%2,08%-0,04%-0,17%-0,17%
98
PricewaterhouseCoopers
F3
Denmark
Financial impact from core and comprehensive levels of GPPDenmarkCleaning servicesConstructionElectricityCatering & foodGardeningOffice IT equipmentPaperTextilesTransportweighted averagetotal financial impact-3,40%-0,62%0,60%0,52%1,85%1,12%16,97%5,67%-0,25%0,31%core0,38%-0,12%0,60%0,52%1,85%0,87%0,00%5,40%-0,25%0,33%comprehensive-3,78%-0,50%0,00%-0,00%0,24%16,97%0,27%--0,02%relative procurement value9%50%18%4%2%6%3%3%4%
Financial impact on cost elementsDenmarkCleaning serviceslabour costscleaning productsConstructioninvestment costcosts for heatingcosts for electricity usecosts for water useElectricitypurchase priceCatering & foodprocurement of foodGardeningmachinery costssoil improversOffice IT equipmentpurchase priceelectricity usePaperpurchase priceTextilespurchase priceTransportroad taxfuel costsfinancial impact-3,40%-4,29%26,19%-0,62%0,25%-6,68%-8,25%-3,23%0,60%0,60%0,52%1,02%1,85%36,97%0,00%1,12%1,72%-12,87%16,97%16,97%5,67%5,67%-0,25%-1,17%-1,17%
Collection of statistical information on Green Public Procurement in the EU
99
F4
Finland
Financial impact from core and comprehensive levels of GPPFinlandCleaning servicesConstructionElectricityCatering & foodGardeningOffice IT equipmentPaperTextilesTransportweighted averagetotal financial impact-6,12%-1,77%0,68%0,05%0,00%0,79%5,43%4,09%-0,99%-0,79%core0,06%-1,77%0,23%0,05%0,00%0,79%0,26%4,09%-0,99%-0,32%comprehensive-6,18%0,00%0,45%-0,00%0,00%5,17%0,00%--0,47%relative procurement value10%37%11%1%2%34%2%1%2%
Financial impact on cost elementsFinlandCleaning serviceslabour costscleaning productsConstructioninvestment costcosts for heatingcosts for electricity usecosts for water useElectricitypurchase priceCatering & foodprocurement of foodGardeningmachinery costssoil improversOffice IT equipmentpurchase priceelectricity usePaperpurchase priceTextilespurchase priceTransportroad taxfuel costsfinancial impact-6,12%-6,82%13,91%-1,77%0,40%-13,62%-16,47%-6,59%0,68%0,68%0,05%0,11%0,00%0,00%0,00%0,79%1,24%-9,29%5,43%5,43%4,09%4,09%-0,99%-4,06%-4,06%
100
PricewaterhouseCoopers
F5
Germany
Financial impact from core and comprehensive levels of GPPGermanyCleaning servicesConstructionElectricityCatering & foodGardeningOffice IT equipmentPaperTextilesTransportweighted averagetotal financial impact-0,85%-0,62%0,75%1,77%0,00%0,78%7,14%2,22%-2,20%-0,32%core0,20%-0,62%0,75%1,77%0,00%0,63%0,00%2,22%-2,20%-0,35%comprehensive-1,05%0,00%0,00%-0,00%0,15%7,14%0,00%-0,03%relative procurement value9%58%11%3%1%7%2%1%9%
Financial impact on cost elementsGermanyCleaning serviceslabour costscleaning productsConstructioninvestment costcosts for heatingcosts for electricity usecosts for water useElectricitypurchase priceCatering & foodprocurement of foodGardeningmachinery costssoil improversOffice IT equipmentpurchase priceelectricity usePaperpurchase priceTextilespurchase priceTransportroad taxfuel costsfinancial impact-0,85%-1,17%13,74%-0,62%0,09%-3,04%-3,68%-1,47%0,75%0,75%1,77%3,80%0,00%0,00%0,00%0,78%1,91%-14,32%7,14%7,14%2,22%2,22%-2,20%-8,00%-8,00%
Collection of statistical information on Green Public Procurement in the EU
101
F6
The Netherlands
Financial impact from core and comprehensive levels of GPPThe NetherlandsCleaning servicesConstructionElectricityCatering & foodGardeningOffice IT equipmentPaperTextilesTransportweighted averagetotal financial impact-3,28%-0,97%2,26%0,45%0,12%0,53%13,34%3,97%-0,33%-0,17%core0,10%-0,96%0,79%0,45%0,00%0,53%1,32%3,88%-0,33%-0,41%comprehensive-3,37%-0,01%1,47%-0,12%0,00%12,02%0,10%-0,25%relative procurement value3%67%17%2%2%2%1%2%3%
Financial impact on cost elementsThe NetherlandsCleaning serviceslabour costscleaning productsConstructioninvestment costcosts for heatingcosts for electricity usecosts for water useElectricitypurchase priceCatering & foodprocurement of foodGardeningmachinery costssoil improversOffice IT equipmentpurchase priceelectricity usePaperpurchase priceTextilespurchase priceTransportroad taxfuel costsfinancial impact-3,28%-3,71%12,47%-0,97%0,18%-5,94%-7,19%-2,88%2,26%2,26%0,45%1,13%0,12%2,47%-0,62%0,53%1,33%-9,97%13,34%13,34%3,97%3,97%-0,33%-1,00%-1,00%
102
PricewaterhouseCoopers
F7
Sweden
Financial impact from core and comprehensive levels of GPPSwedenCleaning servicesConstructionElectricityCatering & foodGardeningOffice IT equipmentPaperTextilesTransportweighted averagetotal financial impact-6,62%-2,14%0,80%0,19%0,11%1,09%13,92%1,42%-1,11%-1,24%core0,05%-1,38%0,00%0,19%0,11%0,96%0,61%1,33%-1,11%-0,72%comprehensive-6,67%-0,76%0,80%-0,00%0,13%13,32%0,09%--0,52%relative procurement value8%56%16%1%2%8%2%1%5%
Financial impact on cost elementsSwedenCleaning serviceslabour costscleaning productsConstructioninvestment costcosts for heatingcosts for electricity usecosts for water useElectricitypurchase priceCatering & foodprocurement of foodGardeningmachinery costssoil improversOffice IT equipmentpurchase priceelectricity usePaperpurchase priceTextilespurchase priceTransportroad taxfuel costsfinancial impact-6,62%-7,39%14,46%-2,14%0,65%-19,81%-24,20%-9,59%0,80%0,80%0,19%0,41%0,11%2,26%0,00%1,09%1,80%-13,47%13,92%13,92%1,42%1,42%-1,11%-4,80%-4,80%
Collection of statistical information on Green Public Procurement in the EU
103
F8
United Kingdom
Financial impact from core and comprehensive levels of GPPUnited KingdomCleaning servicesConstructionElectricityCatering & foodGardeningOffice IT equipmentPaperTextilesTransportweighted averagetotal financial impact-3,44%-7,11%1,19%1,12%1,01%0,67%12,88%0,28%-1,74%-5,70%core0,06%-2,66%1,11%1,12%0,01%0,67%1,56%0,28%-1,74%-2,05%comprehensive-3,51%-4,44%0,08%-1,00%0,00%11,32%0,00%--3,65%relative procurement value1%82%8%3%1%3%0%0%1%
Financial impact on cost elementsUnited KingdomCleaning serviceslabour costscleaning productsConstructioninvestment costcosts for heatingcosts for electricity usecosts for water useElectricitypurchase priceCatering & foodprocurement of foodGardeningmachinery costssoil improversOffice IT equipmentpurchase priceelectricity usePaperpurchase priceTextilespurchase priceTransportroad taxfuel costsfinancial impact-3,44%-3,84%10,35%-7,11%1,68%-47,70%-58,67%-23,08%1,19%1,19%1,12%2,55%1,01%24,48%-6,08%0,67%1,49%-11,19%12,88%12,88%0,28%0,28%-1,74%-6,65%-6,65%
104
PricewaterhouseCoopers
G Results verification interviewsIn the table below, we show details concerning the verification interviews, which we performed in order to verify theanswers given by the respondents.Criteria included in procurement procedure *CleaningConstructionElectricityCateringGardeningOffice ITPaperTextilesTransportFurnitureBackground docCountryType oforganisationInformation sourceprocurement value
Austria
metropolitanmuseum
Internal databaseAccounting departmentNo answerProcurement staff inquiryProcurement staff inquiryAccurate estimationCentralised procurementdepartmentAccounting departmentNo answerProcurement diagnosesNo answerNo answerQuarterly analyses ofprocurement expenditureProcurement staff inquirySoR/ACACNISoR/AC
SoR/NINISoRSoRSoR/NINISoR/NININASoR/NINISoR
SoR
SoR/AC
YesNoNo
Denmark
boroughsemi-public
SoR
SoRSoR/NI
NoNoYes
Finland
countycounty
Germany
county
AC
No
boroughNetherlandsministrycountySwedenagencyboroughUnitedKingdomcounty
AC/NI
ACSoRSoRSoRSoRFAFAFASoR
AC?NIFAFAFAFA
YesYesYesNoNoNo
borough
SoR
SoR
FA
Yes
* Schedule of Requirements (SoR), Award Criteria (AC), Framework Agreement (FA), Information Not Available (NA), Not included (NI)
Reason Not Included (NI)AustriametropolitanmuseumFinlandcountycountyConstructionCleaning, Electricity, Office ITOffice IT, Paper, FurnitureElectricity, Catering, Gardening
ReasonCriteria in regulation set by lawSupply already green(Part of) supply already green(Part of) supply already green + city requirements include greencriteria(Part of) supply already green
Netherlands
county
Transport
Collection of statistical information on Green Public Procurement in the EU
105
ContactFor more information about this publication you can make contact with:Klaas van den Berg,tel: +31 20 568 4350,email: [email protected]orMonique Lempers,tel: +31 20 568 4993,email: [email protected]
Or take a look on our website: www.pwc.com/sustainabilitywww.significant.nl, www.ecofys.nl
pwc.nl
AssurancelTaxlAdvisory
pwc.nl� 2008 PricewaterhouseCoopers. All rights reserved.