Udenrigsudvalget 2008-09
URU Alm.del Bilag 141
Offentligt
TABLE 1: NET OFFICIAL DEVELOPMENT ASSISTANCE IN 2008Preliminary data for 2008
2008ODAODA/GNIUSD million%currentAustraliaAustriaBelgiumCanadaDenmarkFinlandFranceGermanyGreeceIrelandItalyJapanLuxembourgNetherlandsNew ZealandNorwayPortugalSpainSwedenSwitzerlandUnited KingdomUnited StatesTOTAL DACAverage Country EffortMemo Items:ECDAC-EU countriesG7 countriesNon-G7 countriesNon-DAC economies:Czech RepublicHungaryKoreaPolandSlovak Republic13 41270 16880 81538 944213106797386920.420.250.540.110.070.090.080.103 1661 6812 3814 7252 8001 13910 95713 9106931 3254 4449 3624096 9933463 9676146 6864 7302 01611 40926 008119 7590.340.420.470.320.820.430.390.380.200.580.200.180.920.800.300.880.270.430.980.410.430.180.300.47
2007ODAODA/GNIUSD million%current2 6691 8081 9534 0802 5629819 88412 2915011 1923 9717 6793766 2243203 7284715 1404 3391 6859 84921 787103 4870.320.500.430.290.810.390.380.370.160.550.190.170.910.810.270.950.220.370.930.370.350.160.280.45
2008ODAPercent changeUSD million (1) 2007 to 2008 (1)At 2007 prices and exchange rates3 0381 5552 2144 5772 5701 04710 16812 9946361 2694 0598 3103826 5223553 6385706 1384 5081 79412 21725 439113 99913.8-14.013.412.20.36.72.95.726.96.42.28.21.84.811.0-2.421.119.43.96.524.116.810.2
11 63461 54069 53933 948179103699363670.390.230.510.110.080.070.100.09
12 42566 84877 76336 2361789691933077
6.88.611.86.7-0.4-7.431.5-9.014.4
(1) Taking account of both inflation and exchange rate movements.Note: The data for 2008 are preliminary pending detailed final data to be published in December 2009. The data are standardisedon a calendar year basis for all donors, and so may differ from fiscal year data available in countries' budget documents.Source: OECD, 30 March 2009.
1
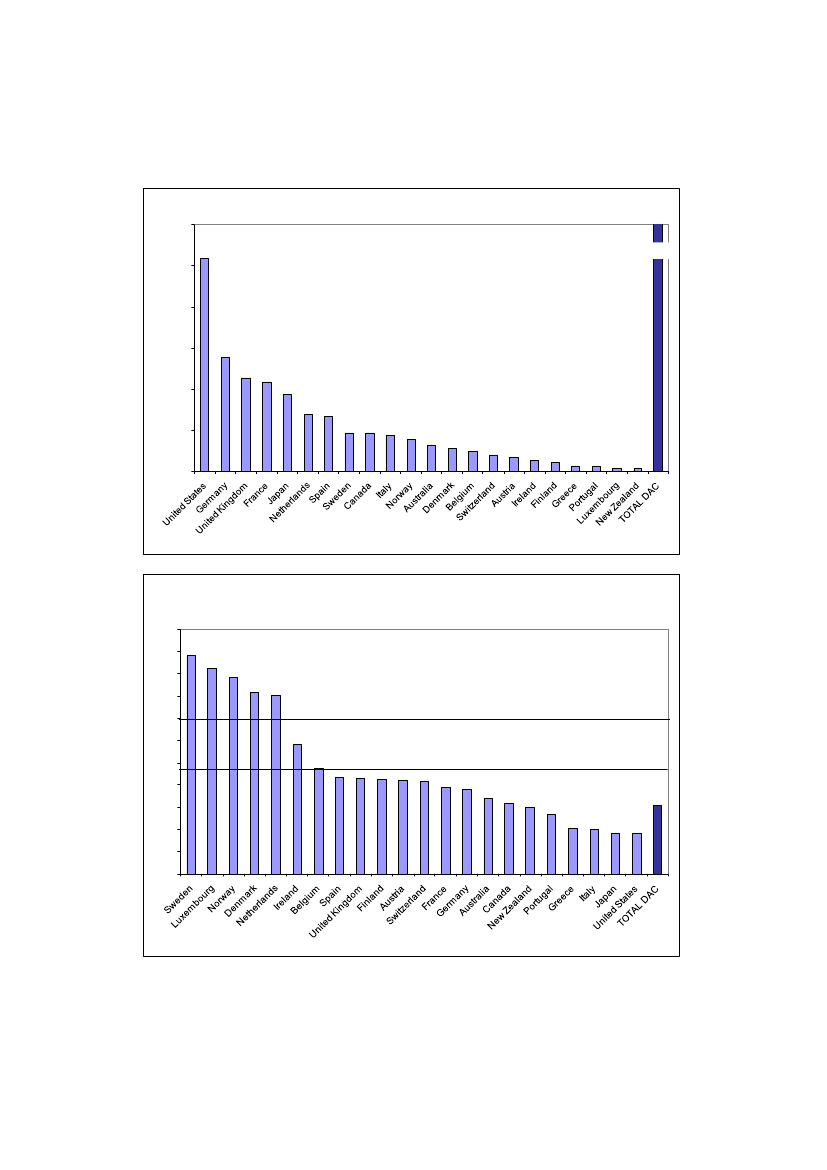
CHART 1: NET OFFICIAL DEVELOPMENT ASSISTANCE IN 2008
USD billion3026.01
Net ODA in 2008 - amounts
119.76
25
20
15
13.9111.4110.96
10
9.366.996.69
5
4.73 4.73 4.443.97
3.172.802.382.021.68 1.321.14 0.690.61 0.410.35
0
Net ODA in 2008 - as a percentage of GNIAs % of GNI
1.11.00.90.8UN Target 0.70.980.92
0.880.820.80
0.70.60.580.470.43
0.50.40.30.20.10.0
Average country effort 0.470.430.430.420.41 0.390.380.340.32
0.300.270.20 0.20 0.180.18
0.30
Source: OECD, 30 March 2009.
2
TABLE 2: SHARE OF DEBT RELIEF GRANTS IN NET OFFICIAL DEVELOPMENT ASSISTANCEPreliminary data for 2008
2008ODAUSD millioncurrentAustraliaAustriaBelgiumCanadaDenmarkFinlandFranceGermanyGreeceIrelandItalyJapanLuxembourgNetherlandsNew ZealandNorwayPortugalSpainSwedenSwitzerlandUnited KingdomUnited StatesTOTAL DAC3 1661 6812 3814 7252 8001 13910 95713 9106931 3254 4449 3624096 9933463 9676146 6864 7302 01611 40926 008119 759of which:Debt relief grantsODAUSD millioncurrent
2007of which:Debt relief grants
Percent changeWithout debt relief grants2007 to 2008 (1)
3373310113396-8992 598--8891 573-252-530342-996552328 687
2 6691 8081 9534 0802 5629819 88412 2915011 1923 9717 6793766 2243203 7284715 1404 3391 6859 84921 787103 487
29292518515123-1 4852 867--5701 576-392-611243746470408 983
26.5-0.819.99.41.86.711.112.126.96.4-4.513.31.87.811.0-2.121.218.95.75.317.815.912.1
Memo Items:ECDAC-EU countriesG7 countriesNon-G7 countries13 41270 16880 81538 9441236 5646 9781 70911 63461 54069 53933 948-6 9346 6232 3605.811.113.29.7
(1) Taking account of both inflation and exchange rate movements.Source: OECD, 30 March 2009.
3
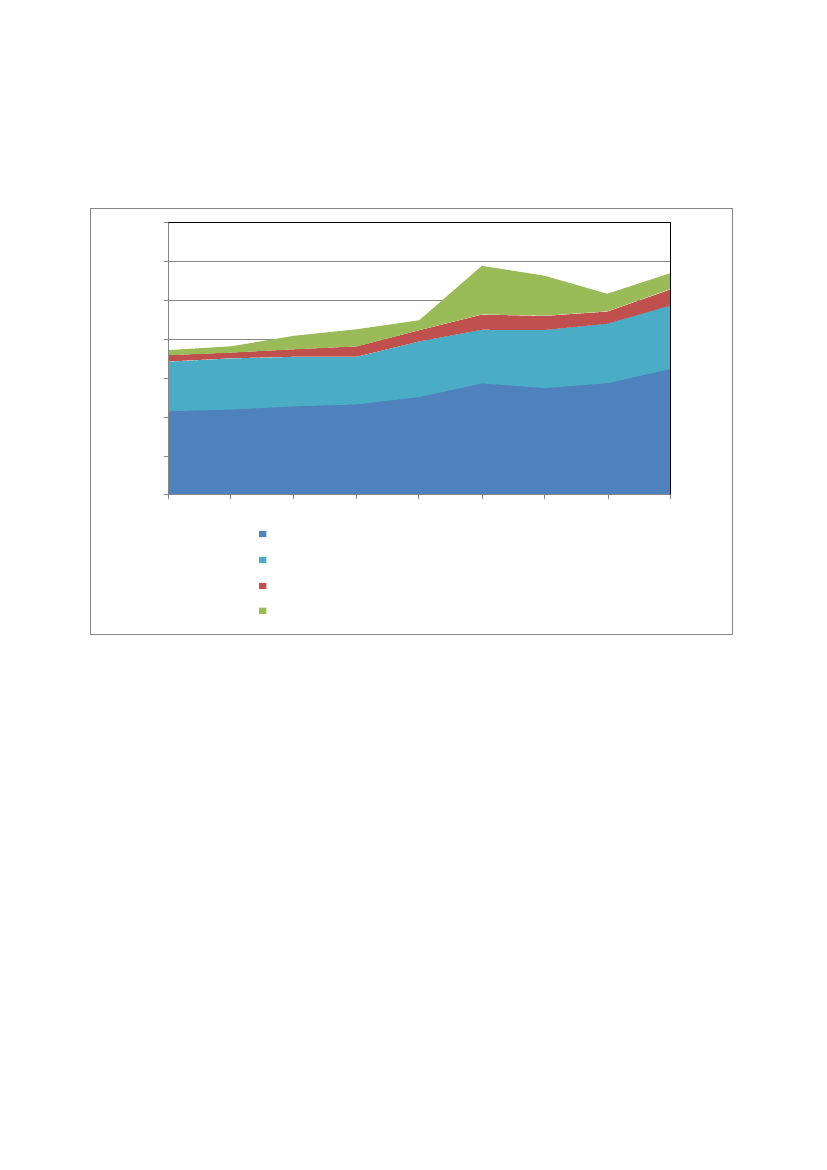
CHART 2: COMPONENTS OF DAC DONORS’ ODA
140120
Constant 2007 USD billions
10080604020020002002200420062008 (preliminary)Bilateral development projects, programmes and technical co-operationMultilateral ODAHumanitarian aidNet debt forgiveness grants
Source: OECD, 30 March 2009.
4
TABLE 3: GROSS OFFICIAL DEVELOPMENT ASSISTANCE IN 2008Preliminary data for 2008
2008ODAUSD millioncurrentAustraliaAustriaBelgiumCanadaDenmarkFinlandFranceGermanyGreeceIrelandItalyJapanLuxembourgNetherlandsNew ZealandNorwayPortugalSpainSwedenSwitzerlandUnited KingdomUnited StatesTOTAL DAC3 1661 6852 4324 7642 8631 13912 38615 8916931 3254 68017 4014097 2823463 9676217 3544 7302 02711 78926 930133 879
2007ODAUSD millioncurrent2 6691 8372 0324 1192 66698111 49813 6875011 1924 29013 5663766 6203203 7284775 4424 3391 69611 62622 691116 351
2008ODAPercent changeUSD million (1)2007 to 2008 (1)At 2007 prices and exchange rates3 0381 5582 2624 6142 6281 04711 49414 8446361 2694 27415 4453826 7923553 6385766 7514 5081 80412 62526 340126 88213.8-15.111.312.0-1.46.70.08.526.96.4-0.413.81.82.611.0-2.420.824.13.96.48.616.19.1
Memo Items:ECDAC-EU countriesG7 countriesNon-G7 countries13 52775 27893 84040 03911 74367 56281 47734 87412 53271 64789 63637 2466.76.010.06.8
(1) Taking account of both inflation and exchange rate movements.Source: OECD, 30 March 2009.
5
TABLE 4: OECD-DAC SECRETARIAT SIMULATION OF DAC MEMBERS’ NET ODAVOLUMES IN 2008 AND 2010In constant 2008 USD millionThe data below are not forecasts, but Secretariat projections based on public announcements by member countries of the OECD’s Development AssistanceCommittee (DAC). The key figures from such announcements are shown as "Assumptions". To calculate net ODA and ODA/GNI ratios requires projections for GNIfor 2010. For 2009 and 2010, the projections of real growth are taken from the OECD Economics Department interim projections to be published on 31 March.Pending updated country specific figures which will be available in June 2009, country specific real growth projections are available and used for each G7 country,whereas Euro area or total OECD real growth projections are used for most other countries. While calculations have been discussed at technical level with nationalauthorities, the DAC Secretariat is responsible for the methodology and the final published results.
2008 (preliminary)Assumptions (ODA/GNI ratios)Net ODACountryAustriaBelgiumDenmark1FinlandFranceGermanyGreece2IrelandItaly3LuxembourgNetherlandsPortugalSpainSwedenUnited KingdomAustralia5Canada6Japan7New Zealand8NorwaySwitzerland9United States10DAC members, total12
2010Real change in ODAcompared with 2008Net ODA(2008USDm)264980- 1771612 9523 777452- 176 423- 14- 3465051 585- 1052 83419 2731001503 94869327- 1541 63925 351Per cent16%41%-6%14%27%27%65%-1%145%-3%-5%82%24%-2%25%27%3%3%42%20%8%-8%6%21%
(2008 USDm)
1 6812 3812 8001 13910 95713 9106931 3254 4444096 9936146 6864 7304
ODA/GNI0.42%0.47%0.82%0.43%0.39%0.38%0.20%0.58%0.20%0.92%0.80%0.27%0.43%0.98%0.43%0.42%0.34%0.32%0.18%0.30%0.88%0.41%0.18%0.30%
(2008 USDm)
DAC EU members, total
11 40970 1683 1664 7259 3623463 9672 01626 008119 759
0.51% in 20100.7% in 2010Minimum 0.8%0.51% in 20100.51% in 2010 and 0.7% in 20150.51% in 20100.35% in 20100.6% in 2010 and 0.7% in 20120.51% in 20100.93% in 2010 and 1% in following yearsMinimum 0.8%0.51% in 20100.56% in 2010 and 0.7% in 20121%0.56% in 2010-11 and 0.7% in 2013See footnote 5See footnote 6See footnote 7See footnote 81% over 2006-09See footnote 9See footnote 10
1 9453 3612 6231 30013 90917 6871 1451 30710 8663956 6471 1198 2714 62514 24389 4413 2664 87513 3104154 2951 86227 647145 110
ODA/GNI0.51%0.70%0.80%0.51%0.51%0.51%0.35%0.60%0.51%0.93%0.80%0.51%0.56%1.00%0.56%0.56%0.37%0.34%0.28%0.35%1.00%0.40%0.20%0.39%
Over the coming years, the Danish government will strive to increase ODA as a percent of GNI from the current level of 0.8%.Due to budgetary constraints, Greece has deferred its EU ODA target of 0.51% to 2012. Greece estimates it will reach an ODA/GNI ratio of 0.35% in 2010.3The Italian authorities advise that Italy’s ODA trend will be influenced by the constraints on Italy’s public finance.4
This Secretariat simulation of 2010 ODA applies its previous estimate of the ODA/GNI ratio in 2010 (0.56%) to its current projections of UK GNI in 2010, expressedat 2008 prices and exchange rates.5
Australia expects to continue increasing its ODA. Australia has announced it intends to reach an ODA/GNI target of 0.5% by 2015-16 and in 2008 the AustralianGovernment announced interim targets of 0.35% in 2009-10, 0.37% in 2010-11 and 0.38% in 2011-12. The figure here is discounted for inflation.6
Canada intends to double its 2001 International Assistance Envelope (IAE) level by 2010 in nominal terms. The Canadian authorities estimate ODA (composed inlarge part from the IAE) will be 5.1 billion Canadian dollars in 2010. The ODA figure shown here is adjusted for inflation and converted to USD at the 2008 exchangerate.7Japan intends to increase its ODA by USD 10 billion in aggregate over the five years 2005-2009 compared to 2004. The Secretariat's estimate assumes USD 4.39billion extra in 2009, compared to 2004, and uses this figure for 2010, supposing that the volume of net ODA in 2009 will be maintained. No adjustment is made forinflation.8New Zealand has indicated an intermediate target of NZD 600 million. The Secretariat estimates an ODA/GNI ratio of 0.35% in 2010.9The Swiss Parliament (the Council of States in September 2008 and the National Council in December 2008) has decided to increase ODA to 0.5% of GNI by2015. The provision of additional resources to meet this objective will be decided after the approval of the additional frame credit in 2009. In the actual financial plan,the ODA/GNI ratio of 0.40% will be maintained from 2009 onwards.10The United States does not issue or approve forecasts on projected ODA. The amount shown here is purely a Secretariat estimate. It is based on 2004 ODA plusUSD 5 billion nominal per annum to cover the Gleneagles G8 commitments on increased aid to sub-Saharan Africa, Millennium Challenge Account, and initiativeson HIV/AIDS, malaria and humanitarian aid.
Source: OECD, 30 March 2009.
6
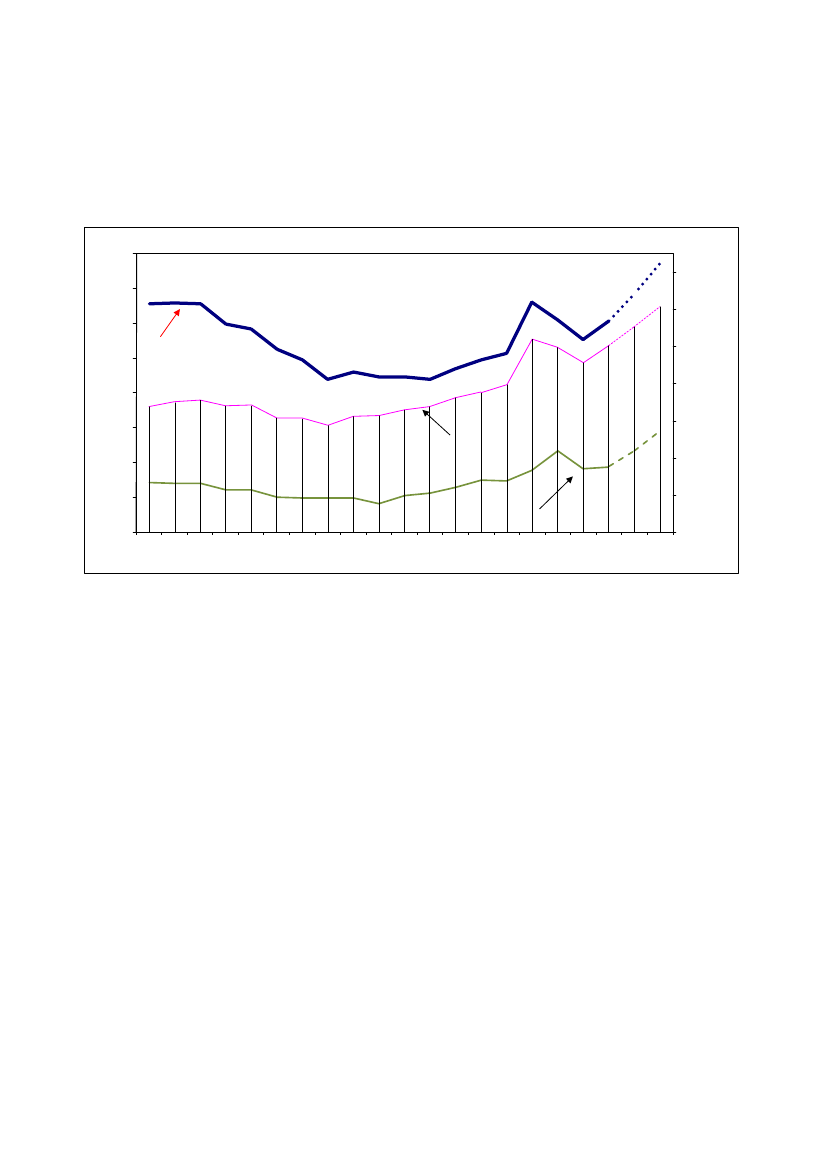
CHART 3: DAC MEMBERS' NET ODA 1990 - 2008 AND DAC SECRETARIAT SIMULATIONSOF NET ODA TO 2009 AND 2010
0.400.350.300.260.25ODA as a %of GNI(left scale)0.220.330.330.30
0.39140
120
100
0.20
80
0.150.100.050.00199019931995199820002002200320052007201019911992199419961997199920012004200620082009
60Total ODA(right scale)
40
ODA to Africa(right scale)
20
0
Source: OECD, 30 March 2009.
7
% of GNI


