Udvalget for Fødevarer, Landbrug og Fiskeri 2008-09
FLF Alm.del Bilag 391
Offentligt
FullyDocumentedFisheryby
JørgenDalskov&LotteKindt‐LarsenNationalInstituteforAquaticResourcesTechnicalUniversityofDenmark
FullyDocumentedFisheryDRAFTFINALREPORTby
JørgenDalskov&LotteKindt‐LarsenNationalInstituteforAquaticResourcesTechnicalUniversityofDenmarkAugust 2009
Denmark and The EU invest in sustainable fishing.The Project is supported by the Ministry of Food, Agriculture and Fisheries and The EU
Ministry of Food, Agricul-ture and Fisheries
The EuropeanFisheries Fund
Technical University of DenmarkNational Institute ofAquatic Resources
Charlottenlund SlotJægersborg Allé 1DK-2920 CharlottenlundDenmark
Tel
+45 33 96 33 00
Dir. +45 33 96 33 80Fax +45 33 96 33 33
2
EXECUTIVESUMMARYTheDanishGovernmentplatforminNovember2007announcedthatDenmarkwouldtablea proposal for a change of the Common Fisheries policy towards a management systembasedonincentivesandtransparentandunderstandablerules.
Minister of Fisheries Eva Kjer Hansen in September 2008 presented a comprehensive pro‐posaltotheCouncilofMinisters.ThelimitationoffishingpossibilitiesbyTACsandquotasremainstheprimarytoolintheminister’sproposal.However,theTACsandquotasshouldrelatetothetotalcatchandnotonlytothelandingsasitisthecaseinthepresentmanage‐mentsystem.Thismeansthatthefishermenwouldbeaccountablefortheirtotalcatches,in‐cludingeventualdiscardsandnotonlythepartofthecatchthatislanded.Thetotalcatchac‐countingsystem(catchquotascheme)shouldbeimplementedgraduallyonavoluntaryba‐sisandfishermenshouldhaveanincentivebyquotaincreasesthatcompensatesforthere‐quirementthatallcatchescountontheirquota.Theprerequisiteforenteringintothecatchquotaschemeisthatthefishersoperatingundertheschemecangiveafullandreliabledocumentationofalltheircatchesincludingdiscards.Inordertodemonstratewhethera“FullDocumentationbyElectronicObservation”cande‐liver the required documentation, a one year pilot project was conducted by The DanishTechnicalUniversity.Theelectronicmonitoring(EM)systemusedinthepilotprojectconsistedofuptofourclosedcircuittelevisioncameras,aGPSreceiver,ahydraulicpressuresensor,agearrotationsensorandasystemcontrolbox.TheEMSystemwasinstalledon7volunteercommercialfishingvessels where the cameras provided view of the aft deck and closer views of the fish han‐dlingareasanddiscardchuteareasforcatchidentification.Theobjectivesweretoevaluatethereliabilityandfunctionalityofthe(EM)systemasatooltomonitordiscardofcodinDanishtrawl,gillnetandseinefleets,andthesecondaryobjec‐tivewastodocumentcatchhandlingandobservethediscardpatterntoverifywhetherdis‐cardofcodwascorrect.Furthermorefishers’viewsregardingthesystemandtheincentiveeffecthavebeenevaluated.TheEMsystemhasbeencollectingsensordataandimagesthroughouttheperiodSeptember2008 to July 2009. According to the vessel logbooks the vessels havebeen at sea for 16,955hours,carriedout561fishingtripsconduced1,558fishingoperationsduringtheprojectpe‐riod. Until now data from 81% of the trips have been processed and used for the analysispresentedinthisreport.Thiscorrespondsto13,935hourssensordata.Dataonfishingopera‐tionshasbeencollectedin5,708.1hours.
3
Theanalysisofthesensordata(GPS,hydraulicpressureandrotationofthewinches)showthat determination of where and when a fishing operation takes place can be made with ahighdegreeofaccuracy.Inadditionbyviewingthevideositcanbedeterminedwhetherthevesselactuallyisfishingorforexamplejustcleaningthenet.Anestimateofthetotalcatchamountandthespeciescompositioncanbemadebyviewingthevideorecordsofthecatchhandlingonboard.Thefocalpointforthisprojecthasbeenthedocumentationofdiscardsofcod.Theresultsofthepilotprojectshowthattheestimateofdiscardsofcodbyviewingthevideorecordscanbemadewithhighaccuracy.Especiallyifthevesselhadasortingconveyorbeltwherethediscardedfishpassedthediscardshutein‐dividually. If large amounts of discards occur the accuracy of the estimate of the discardamounts degreased unless specific obligations for handling the discard were followed.Theconclusionisthatimagequalityofthevideorecordingsisveryhighandcanbeusedtopro‐videreliableestimatesofspeciesandsizecompositionofthecatchandeventualdiscards.ThecostfordocumentingavesselsfisheryusingEMissignificantlowerthanobtainingthesamedocumentationusingobserverschemes.Theanalysisshowedthatonaveragelessthanonehourdataanalysisandimageviewingisrequiredforverifyingonefishingeventandtheassociatedcatchhandling.Theexperiencesgainedduringthepilotprojecthaveshownthatthefishershavebeenmoreactiveinavoidingcatchesofsmallcod.Iflargequantitiesofsmallcodhavebeencaughtthefisherhavechangedfishinggroundandeventriedtochangemeshsize.Furthermore,therehasbeenapositivereactionfromthefishersandtheyhaveshownanincreasedawarenessoftheirfishingpattern.Theideaofgivingtheindividualfishersanincentivetoreducediscardsby introducing a catch quota systemwhere all catches (retained and discarded part) arecounted against the quota and the fisher is responsible for documenting his fishery can beseenasawayforwardtowardsustainablefishingwherethecatchesareutilizedoptimal.Theelectronicmonitoringsystemhasprovenitsfunctioning.Theexperiencesobtaineddur‐ingthispilotprojecthaveshownthattheEMsystemcanbeappliedonalmostalltypesofpelagicvesselsandthevesselsfishingforsandeel,sprat,bluewhitingandNorwaypoutandlargerfishingvesselsfishingforhumanconsumptionpurposes,whereitcangivea100%do‐cumentationofthefishingactivities.Onboardothervesselsitmaybenecessarytoadaptcer‐tainvesseldecksetupandworkinginteriorinordertoobtainsufficientcoverageofthedo‐cumentation.
4
EXECUTIVESUMMARY..................................................................................................... 31INTRODUCTION................................................................................................................. 62METHODOLOGY................................................................................................................ 72.1Selectionofvesselstobeusedfortheproject........................................................... 82.2EMSystemSpecifications............................................................................................. 92.3DataCaptureSpecifications....................................................................................... 112.4EMPilotProjectOperations....................................................................................... 112.5EMDataInterpretation............................................................................................... 122.5.1SensorDataAnalysis........................................................................................... 132.5.2ImageDataInterpretation................................................................................... 132.5DataReporting............................................................................................................. 143RESULTS.............................................................................................................................. 153.1Collecteddata.............................................................................................................. 183.2Fishingeventanalysis................................................................................................. 193.3Catchdataanalysis...................................................................................................... 233.4Analyzingtimeandimagequality........................................................................... 243.5Observerdataanalyses............................................................................................... 253.6Landingdataanalysis................................................................................................. 273.7 Length distributions of cod discards .............................................................................. 304DISCUSSION...................................................................................................................... 314.1EMsystem‐hardware................................................................................................ 314.2Imagedata.................................................................................................................... 324.3Sensordata................................................................................................................... 384.4 Fishers involvement ....................................................................................................... 394.5EMandsurveillanceperspectives............................................................................ 414.6Costissues.................................................................................................................... 425CONCLUSIONSANDRECOMMENDATIONS........................................................... 426REFERENCES..................................................................................................................... 457 ACKNOWLEDGEMENT .................................................................................................... 458APPENDIXES......................................................................................................................46Appendix1......................................................................................................................... 46Appendix2......................................................................................................................... 51
5
1INTRODUCTIONInNovember2007theDanishgovernmentputforwardanewgovernmentplatformstatingthefollowingobjectiveforthefisheriespolicy:“ThegovernmentwillputforwardaproposalforaNewCommonFisheriesPolicy.SincetheCFPwasintroduced,theruleshavebecomemoreandmorecomplicated.Anewpolicymustensureamoresimplemanagementanditmustrewardsustainablefishing.ThepresentTACandquotasystemhasnotrestrictedfishingmortalitytolevelscon‐sistentwithmaximumsustainableyieldsandformanystocksinCommunitywatersthere are a substantial gab between the reported total landings and the actual totalouttakeofthestock.TACsandquotasremainstheprimarytoolintheDanishGovernmentsproposalforaNewCommonFisheriesPolicy(CFP).Howevertheindividualfishershouldbeac‐countableforhistotalcatches,notonlyhislandingsatport.Thismeansthatdiscardsaswellaslandingsshouldbecountedagainstthequotas.The proposal for a new resource management scheme would make the individualfisherresponsiblefortheimpacthisfisheryhasonthestocksratherthanjustbeingaccountable for the fish landed. Fishers should be given the freedom to optimizecatchesin relation to impactandtheywill have to carry theresponsibility of docu‐mentingtheirdoings.Theproposedschemerequiresthatallcatchesandnotonlylandingsaremonitored,reportedandcanbedocumented.Inordertodemonstratewhethera“Fulldocumen‐tation by electronic observation” can deliver reliable documentation of catches theNational Institute of Aquatic Resources (DTU Aqua), Technical University of Den‐marklatein2007startedpreparingaoneyearpilotproject.In January‐February 2008 DTU Aqua carried out a feasibility study to evaluate theElectronic Monitoring(EM)technologydevelopedbyArchipelago Marine ResearchLtd. (Archipelago), Victoria, BC, Canada.The feasibility study concluded that thecombinationofproprietarysoftwareandextremelydurablehardwareallowEMsys‐temstocollectpertinentat‐seacommercialfisherydata.Whenpowered,EMsystemsarecapableofcontinuouslyloggingdataonvesselposition,hydraulicpressure,andwinchordrumrotationsaswellascapturinghighqualitydigitalimageryofcatch.
6
BasedontheresultsofthefeasibilitystudyDTUAquainitiatedapilotprojectfortheperiodMay2008toSeptember2009.Theobjectivesfortheprojectwere:•To test whether electronic monitoring can be used to provide reliable docu‐mentationofthefishingoperationandthecatches.•Todemonstratethatafullydocumentedfisherycanensure:•thattotalcatches‐landingsanddiscard–arerecorded,•thatavesselselfsamplingsystemprovidesdatausefulinthescientificassessmentofthefisheriesandthestocks,•animprovedeconomyforparticipatingvessels,•adocumentationthatcanbeusedinevaluatingthesustainabilityofthefishery.•To investigate how a fishery management system where vessels with fulldocumentationgetincentivesinformofincreasedfishingpossibilitieswillaf‐fectthebehaviourofthevesselsinvolved.•TominimizediscardsofcodintheDanishfishery.•ToassessthesuitabilityofEMsystemforvariousfishingandvesseltypes,andobtain skipper and crew feedback on the acceptability and suitability of EMsystems.
2METHODOLOGYArchipelagohassuccessfullydevelopedanddeployedvideobasedelectronicmoni‐toring(EM)onavarietyofgearandvesseltypes(McElderryetal.,2005,McElderryetal.,2006,McElderry,H.2008). Therefore, DTUAqua decided touse the EM systemdevelopedbyArchipelagointhispilotproject.The detailed project planning began in July 2008 where staff from DTU Aqua andArchipelago met to discuss operational issues for the project and to review specificinformationrequirements.AtthesametimeacontractbetweenDTUAquaandAr‐chipelago Marine Research Ltd. was signed. The contract included hardware (EMsystems),softwareforanalysingcollecteddataandconsultantassistancewhereAr‐chipelagoshouldtrainDTUininstallinghardwareonthevessels,trainDTUstaffus‐ing the software and finally assist on technical and scientific matters to ensure ac‐complishmentoftheproject.
7
DTUAquapurchasedsixEMsystemsandtreebackupsystemsincaseofbreakdownofoneofthesystems.
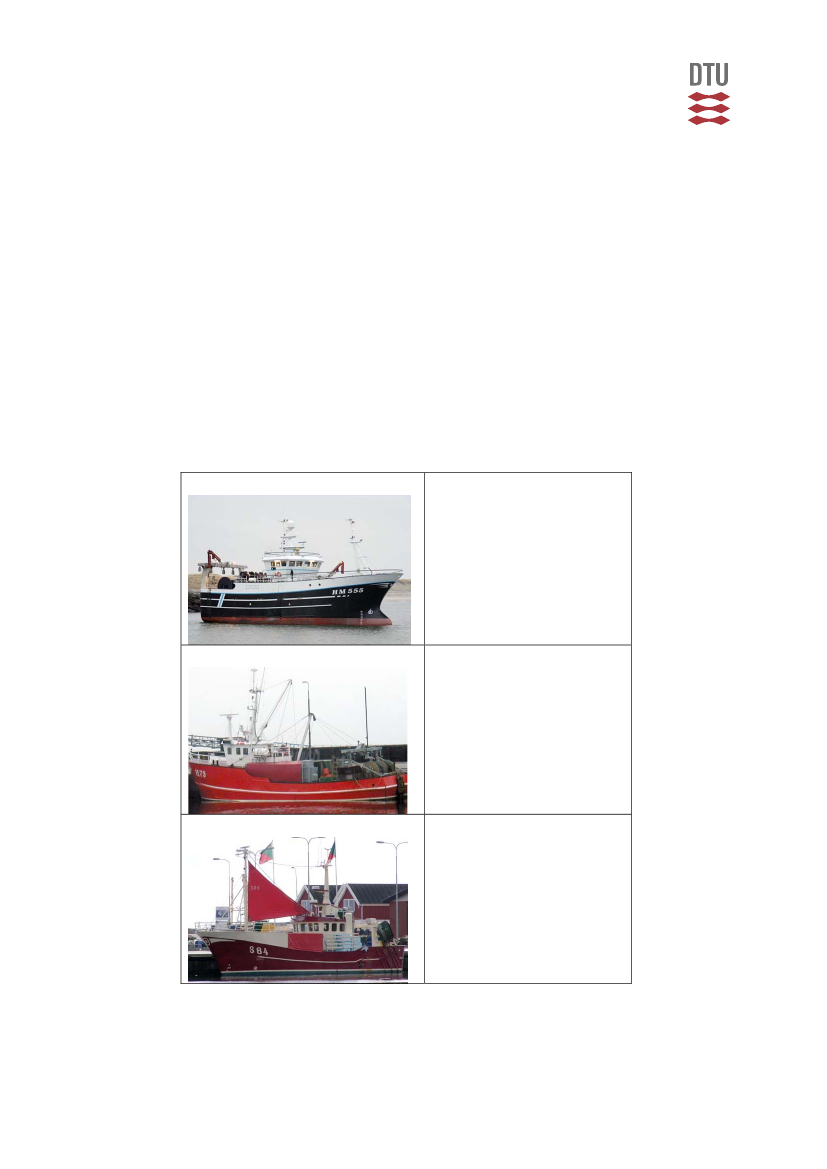
2.1SelectionofvesselstobeusedfortheprojectIn May 2008 DTU Aqua called for fishing vessels volunteering to participate in thepilotproject.Amongthetotalnumberofvolunteeringvessels6vesselswereselected.Four trawlers: HM 555 “Kingfisher”, S 85 Frk. Nielsen, H 79 “ Tiki” and ND 399 “Meonia”,oneDanishseinerHM423“FruMiddelboe”andonegill‐netterS530“Yo‐kotani”.TheND399“Meonia”wassoldultimoJanuary2009.UltimoFebruary2009avesseltoreplace“Meonia”wasselectedandacontractwithND176“Søstrene”wasagreed.Specificationoftheparticipatingvessels:Homeport: HanstholmHM 555 KingfisherVessel type: TrawlerBuilding year: 2007Length over all: 31.3 mBT: 467Engine: 736 kWPower: 220 AC
H 79 Tiki
Homeport: GillelejeVessel type: TrawlerBuilding year: 1976Length over all: 17.1 mBT: 49.7Engine: 309 kWPower: 220 AC
S 84 Frk. Nielsen
Homeport: SkagenVessel type: TrawlerBuilding year: 1997Length over all: 16.7 mBT: 44.2Engine: 220 kWPower: 220 AC
8
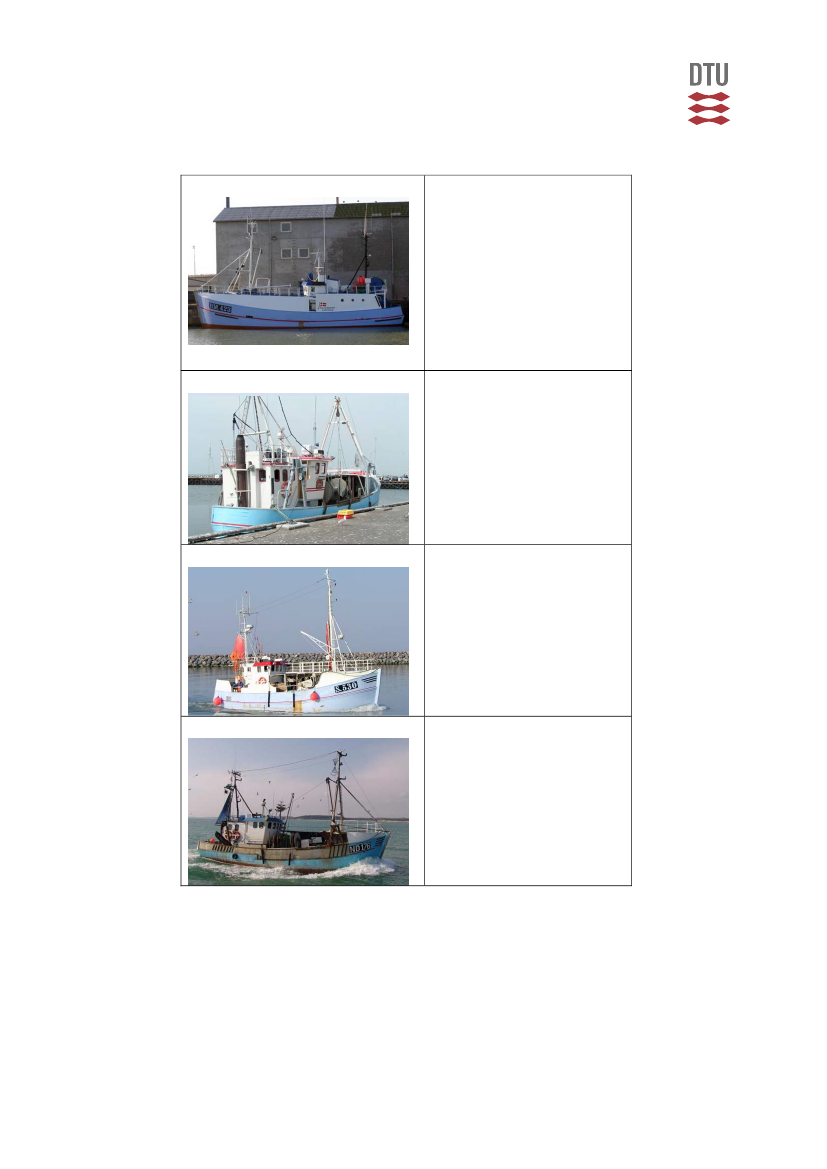
HM 423 Fru Middelboe
Homeport:Hanstholm/HirtshalsVessel type: Danish SeinerBuilding year: 1983Length over all: 20.4 mBT: 86.1Engine: 219 kWPower: 220 AC
ND 399 Meonia
Homeport: KlintholmVessel type: TrawlerBuilding year: 1974Length over all: 15.78 mBT: 19.98Engine: 216 kWPower: 24 DC
S 530 Yokotani
Homeport: SkagenVessel type: NetterBuilding year: 1987Length over all: 14.39 mBT: 17.3Engine: 80 kWPower: 220 AC
ND 176 Søstrene
Homeport: KlintholmVessel type: TrawlerBuilding year: 1983Length over all: 16.57 mBT: 19,9Engine: 221 kWPower: 220 AC
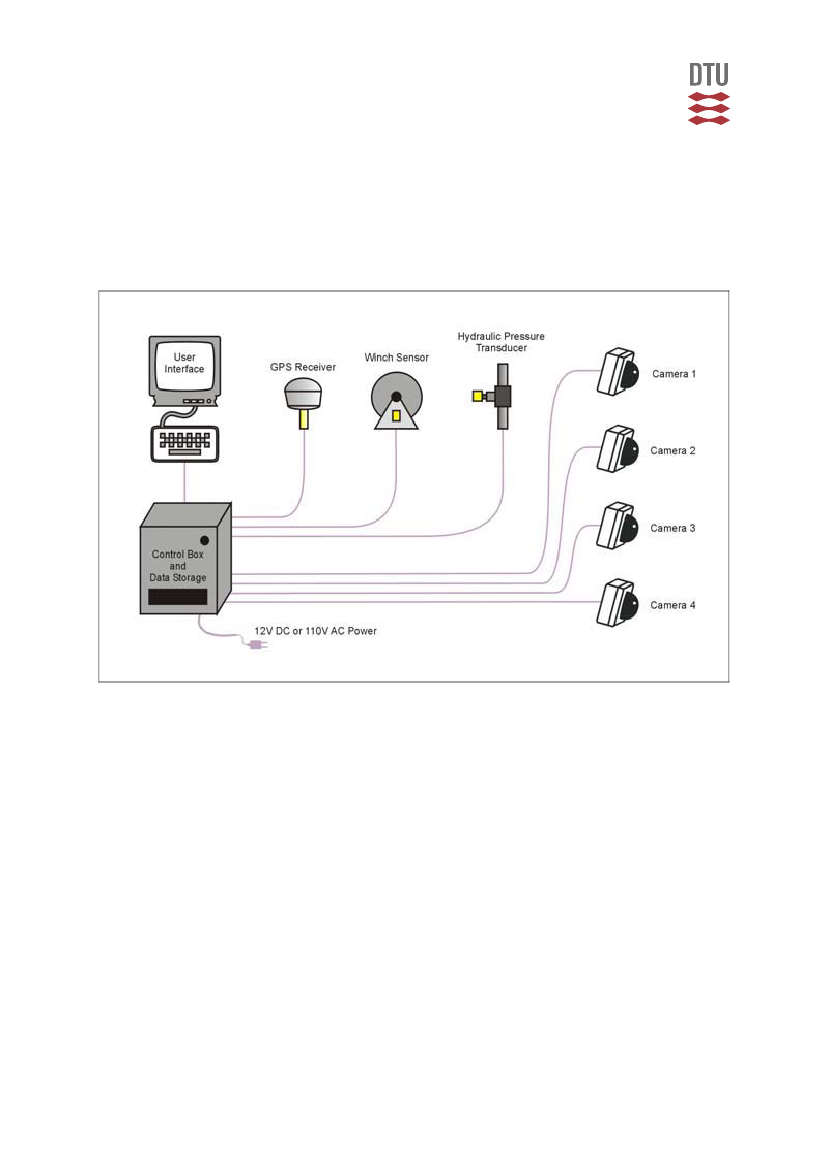
2.2EMSystemSpecificationsTheEMsensorsystemscomprisedaGPS,hydraulicpressuretransducerandapho‐toelectricdrumrotation(winch)sensor(Figure1).AmoredetaileddescriptionofthesystemisgiveninAppendix1.Eachvesselwasalsoequippedwithuptofourwater‐
9
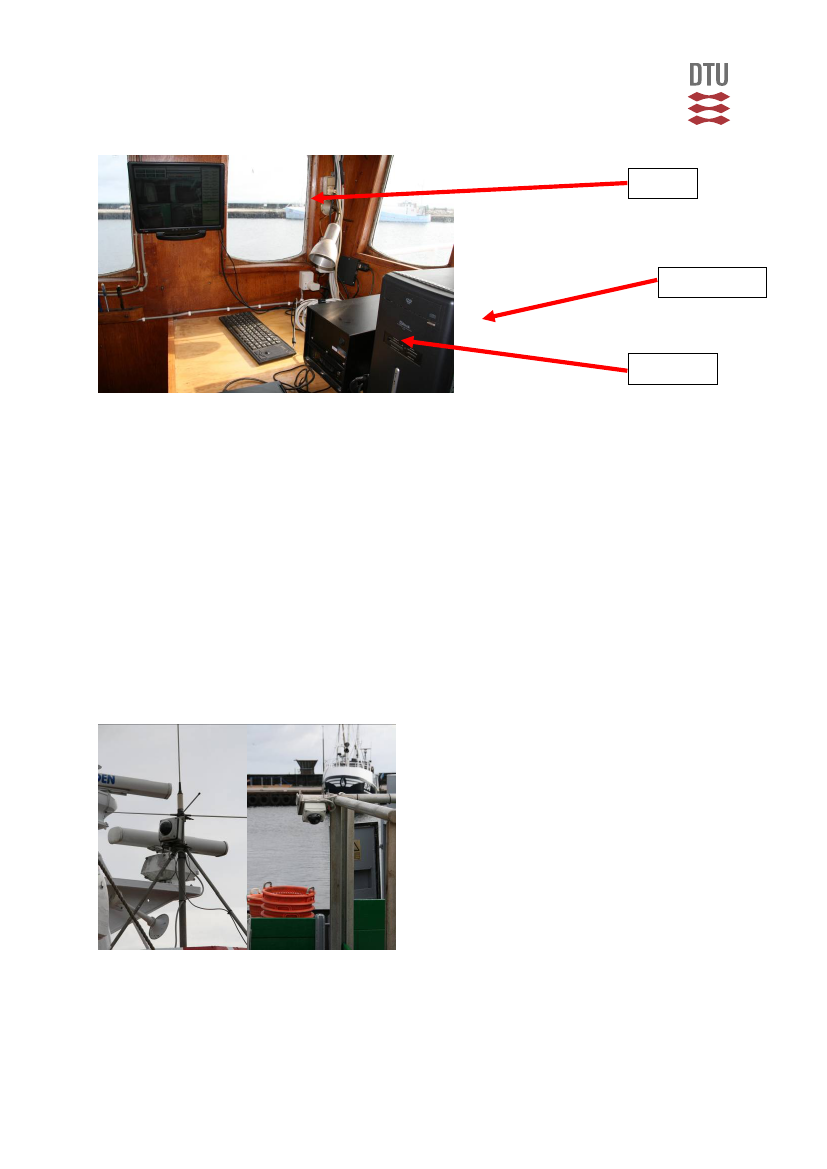
proof armoured dome closed circuit television (CCTV) cameras providing an over‐head view of the aft deck and closer views of the fish handling areas and discardchuteareasforcatchidentification.Sensorsandcameraswereconnectedtoacontrolbox located in the wheelhouse. The control box consisted of a computer that moni‐toredsensorstatusandactivatedimagerecording.
Figure1Schematicdiagramoftheelectronicmonitoringsystem,whichcanrecordvideodatafromuptofourcameraspervessel.
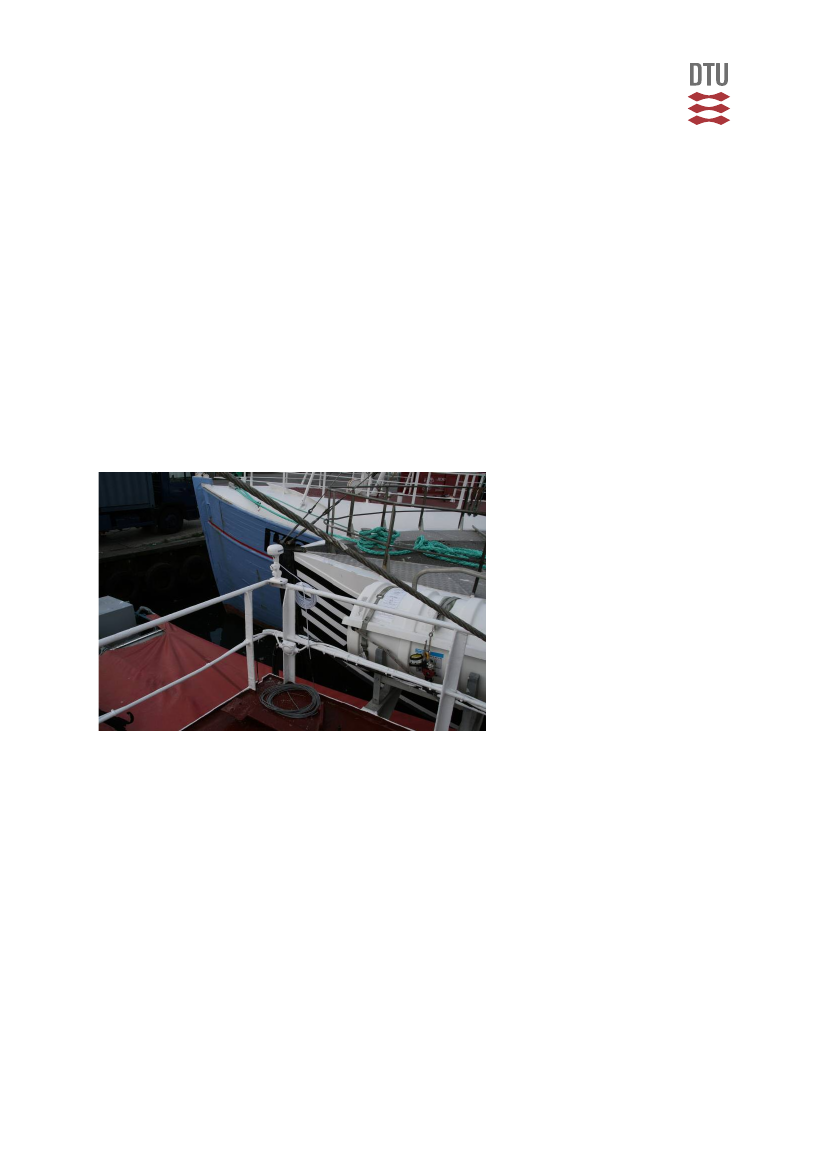
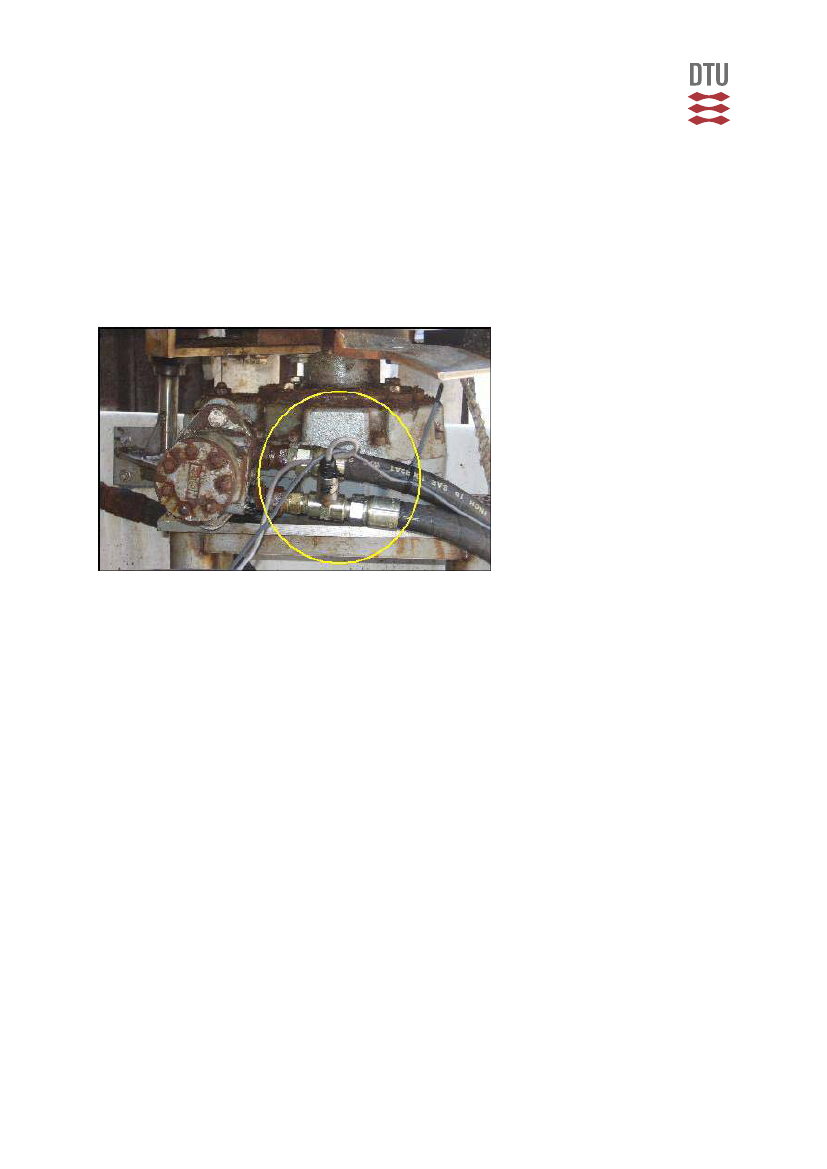
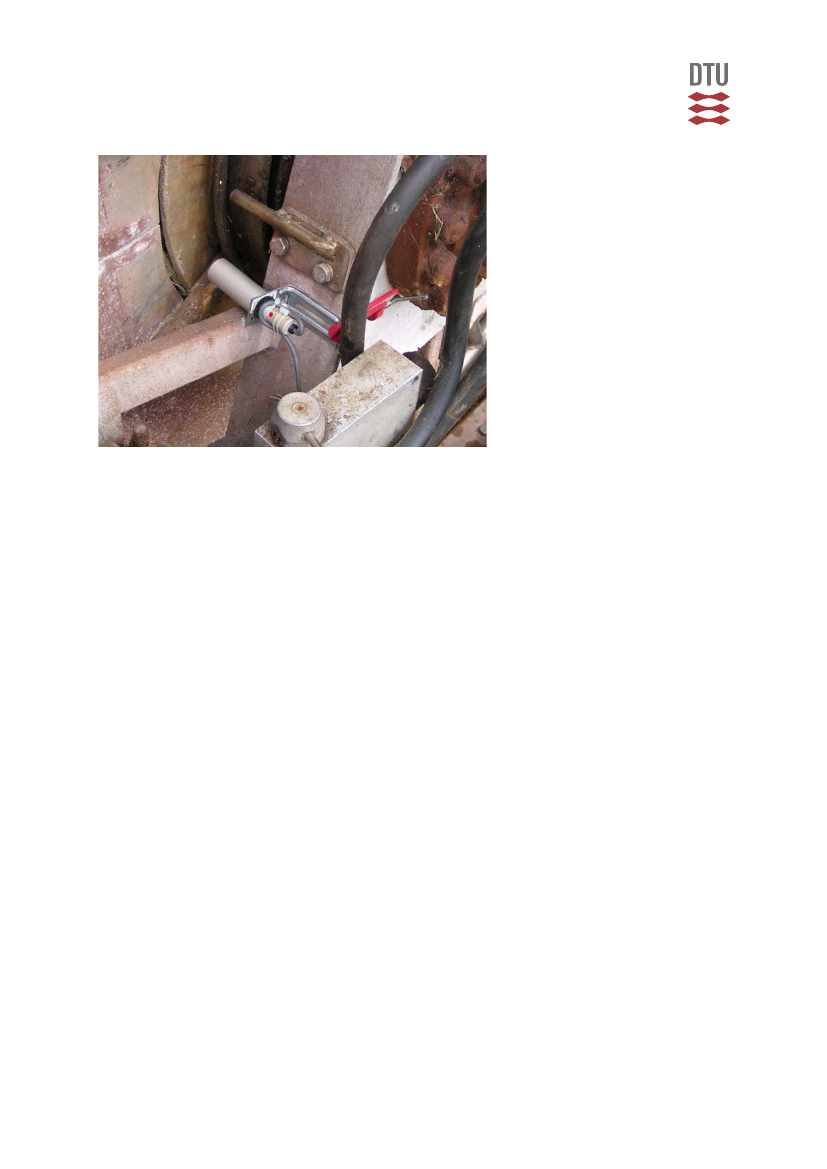
The EM system’s GPS receiver was mounted in the vessel rigging or on top of thewheelhouseandtheelectronicpressuretransducerwasinstalledin‐linewiththehy‐draulic system of each vessel. The rotation sensor was on the trawlers mounted atone of the trawl wire winches, on the Danish seiners on the rope drum and on thegillnettersonthehaulingmachine.Camerasweremountedinareasthatrequiredminimumfabricationwhileobtainingunobstructed views of catch handling and the discard chute areas. On each vessel,every effort was made to mount cameras and sensors in the best possible location.However, as a consequence of the temporary nature of pilot programs, cameraplacementswereopportunisticandamoreoptimalplacementforviewingthefish‐ingoperationsmaybepossibleinapermanentsetup.Duringtheprojectcatchhan‐
10
dling area on one of the vessels, the “Kingfisher”, was renovated where all formerconveying belts and gutting machines were removed and new gutting and filletingmachinesandnewcompleteconveyingbeltswereinstalled.Inconnectionwiththisrenovationnewcamerasettings(cameralocationandviewarea)weretested.EM control boxes were mounted inside the wheel house of each vessel, and sensorand camera cables were drawn to the wheel house either trough ports already inplaceforhydraulicandelectricallinesorinportsmadebyDTUAquastaff.The data logging program was designed to boot up automatically whenever pow‐ered, or immediately after power interruption. EM system power was provided bythevessel’s220VACsystem.Thecontrolboxcontaineddatastoragecapabilityforabout30daysofvesselfishingactivityon500GBharddrives,andthecomputerwassettocollectandstoresensordata(GPS,hydraulicpressureanddrumrotation).
2.3DataCaptureSpecificationsEM sensor data was recorded continuously while the EM system was poweredwhich,inprinciple,wasconstantlyduringtheentirefishingtrip(porttoport).Imageshootingoccurred from thebeginning of thefirstfishingoperation (when the pres‐suresensorortherotationsensorwasactivated)untilthevesselreturnedtoport.Allimageryincludedtextoverlaywithvesselname,date,time,andposition.Sensordatawasrecordedatafrequencyof10secondsanddatastoragerequirementwas0.5MBperfishingday.TheEMsystemwascapableofreceivingvideoinputsfromuptofourCCTVcamerasatselectableframerates(framespersecond),rangingfromoneto30(motionpicturequality). During this project a frame rate from two to five frames per second wasused which gives a data storage requirement of app. 60 – 300 MB per camera perhour,orabout400‐1000hoursforfourcamerasanda500GBharddrivedependingofframeratesetting.
2.4EMPilotProjectOperationsDuringthefirsttwoweeksofSeptember2008anArchipelagoEMtechniciantogetherwithstafffromDTUAquainstalledtheEMsystemonboardthesixvessels.Onlytwovesselshadtobevisitedtwicetocorrectthesystemsetupandcabling.Duringthein‐stallation the skipper was consulted regarding positioning of equipment and cabel‐
11
ling,andonboardelectricalandhydraulicsystemswereassessedforoptimalsensorplacement,powerrequirements,andgeneralEMsystemintegration.Atthecomple‐tionofeachinstallation,theEMtechnicianpoweredthesystemandtested itscom‐ponents to ensure functionality. EM system performance has been monitoredthroughregularservicebyDTUAquatechnicians.TofacilitateanevaluationofEMdatacollectionstafffromDTUAquaparticipatedasobserversinanumberoffishingtrips.Partlytooverlookthecatchhandlingprocess,partlytocheckwhethertherecordeddiscardsamountwascorrectandtobeabletocheck discards pattern on trip level with or without having an observers onboard.WhenanobserverwasdeployedonboardtheobserverensuredthatthecrewhadtherequiredknowledgeandexpertisetoruntheEMsystem.StafffromDTUAquawasregularlyincontactwiththeskippersinordertoensuretheirfocusontheimportanceofthepilotprojectandtohaveanoverviewoftheper‐formanceoftheEMsystems.Whenaharddiscwasapp.80%fullthediscwasex‐changedwithanemptydisc.AssoonthedatawasinhouseatDTUAquaabackupofthedatawassavedonaserver.Thecollecteddatawasatalaterstagecomprehen‐siveprocessedbyDTUAquastaffundersupervisionofArchipelago.
2.5EMDataInterpretationTheEMharddrivesfromthevesselswerecollectedbystafffromDTUAquafordatastorage and interpretation. Bothsensorandimage data were interpreted. All ofthesensordatawasinterpretedwithinaserverlocatedatArchipelago’sVictoria,Canadaoffice.DatasetswereinterpretedbyDTUstaffandbyArchipelagostaff.Somedatasets were interpreted by both for checking consistency in interpretation. All of thesensordatainterpretationoutputshavebeendeliveredtoDTUAquaforfinalanaly‐sis.Archipelagohaspreparedadocumentdescribingthemainconceptssurroundingthesensordatainterpretationforthisproject.Thedocumentdescribesthesensordatain‐terpretation outputs delivered, offers examples of useful ways of summarizing thedata,andoffersinsightintothemainsourcesoferrorintheinterpretationsthatcouldlead to problems during analysis. Findings described in the Archipelago documenthavebeenincludedinthepresentreport.
12
2.5.1SensorDataAnalysisThepurposeofsensordata(GPS,hydraulicandwinchrotation)interpretationwastodeterminethespatialandtemporalparametersforstartandendofeachfishingtripand fishing event. The key vessel activities including transit, gear setting, and gearretrievalhasbeenidentified.Inthisproject,EMdatawascollectedafterseveralfishingtripsweremade.Thus,foreachEMdatasettherewereseveralindividuallandings.Interpretationwasdoneforeach data set as a unit, resulting in several ‘departure’and ‘return’ entries for eachdataset.Fishingeventswerenumberedchronologicallyfortheentiredataset.EM sensor data interpretation was facilitated using software at a server situated atArchipelago.Usingthissoftwarethesensordataispresentedastimeseriesandspa‐tialplots.ForillustrationseeAppendix2forthedifferentvessels.
2.5.2ImageDataInterpretationTheobjectivesofimageinterpretationaretoexamineallfishingevents,assessimagequality and to assess the amount of fish caught for comparison with the catchamountrecordedbythecrew.Thesecondaryobjectivewastodocumentcatchhan‐dlingandobservethediscardpatterntoverifywhetherdiscardofcodwerecorrectlymonitoredandrecordedbythecrew.The video analyzer software used provided synchronized playback of all cameraviews although usually one camera view was used for catch determinations. Thespeedofimageplaybackwasvaryingdependingoncatchmixtureandimagequal‐ity.Itisexperiencedthatthemajorityofimagerycanbereviewedataratefivetotentimesfasterthanrealtime.InordertoevaluatetheconsistencyofEMviewerdeter‐minations,randomlyselectedimageryoffishingoperationshasbeenreviewedasec‐ondtimebyadifferentviewerandtheresultscompared.Imagequalitywasassessedasanaveragefortheentiretrip,usingthefollowinggeneralscale:•High Quality–camera lenses properly focused, viewing areas clearly visible,andgearretrievalandcatchprocessingeasytoassess.•Medium Quality‐some loss of resolution from pixilation, sunlight glare, ormoisture;poorcamerapositioning,orminorobstructionofviewbutgearre‐trievalandcatchprocessingstillassessable.
13
•
•
Low Quality–reduced light, increased pixilation, water spots on lenses, poorfocus or major obstruction of view; fishing activity generally difficult to re‐solve.NoData–imagequalitylow,orcameraviewstotallyobstructed,ornoimageryavailableandthereforeanalysisnotpossible.
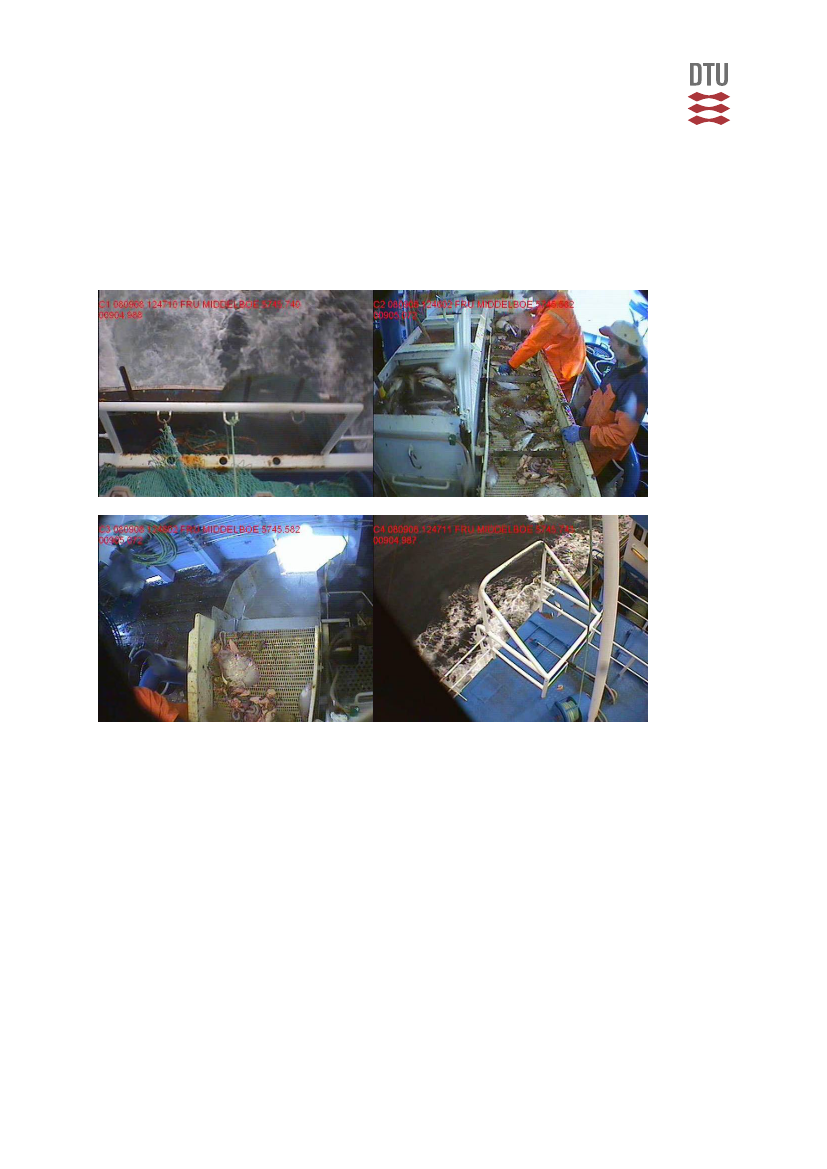
Figure1ExampleEMvideosnapshotsfromtheDanishseinervesselHM423,FruMiddelboeshowingahighqualityviewwherethepictureisclearforallthefourcameras.
Ingeneral,thequalityofthevideoshasbeenveryhigh.Onlyrarelythequalityhasbeenmediumtolowduetogreasylenshoodsorwateronthelenshoodafterclean‐ingupthedeck.Weather,lightconditionsorotherfactorsthatcanhaveaneffectonthevideoqualityhasnotbeenaproblemduringthetrial.
2.5DataReportingTheskippersonthesixvesselswereinadditiontotheofficiallogbookrequirementsrequestedtoreportadditionalinformation.Foreachindividualfishingoperationthefollowinginformationwasrecorded:
14
Date,timeandpositionofshootingthegear,timeandpositionofhaulingthegear,totalcatchinweight,weightofretainedpartofthecatchbyspecies,totalweightofdiscardedcod,lengthmeasurementofdiscardedcod,weightofdiscardofotherspe‐cies.All sensor data was analysed by staff from DTU Aqua and for quality assurance arandomselectednumberoftripswillbecheckedbystafffromArchipelago.Thesen‐sordatawasusedtodeterminedateandtimeoffishingeventstartandfishingeventendaswellasthepositionofthefishingeventasdescribedinsection2.5.1.Thetimeusedforcarryingouttheanalysisisrecordedinordertoestimateman‐powercostsforthispartoftheanalysis.VideodatawasanalysedbystafffromDTUAqua.SensordataqualitywasassuredbystafffromArchipelago.Thevideodatahas,asthesensordata,beenusedtode‐terminedateandtimeforfishingeventstartandfishingeventendaswellasthepo‐sition of the fishing event. Furthermore, the catch handling process has been over‐lookedinordertoestimatetotaldiscardsandtoidentifytheamountofdiscardsbyspeciesgroups.The discard video data were processed by dividing the discard into eight differentcategories.••••••••Unknownspecies(UBS)Cod(TOR)NorwayLobster(DVH)RaysandSkates(ROK)Flatfishes(FLX)Roundfish(TFX)Invertebrates(INV)NoDiscards(NDI)
After each catch handling session the estimated weight of the 8 species or speciesgroupcategorieswasnotedin9differentweightintervals0‐5kg,5‐10kg,10‐20kg,20‐50kg, 50‐100kg, 100‐250kg, 250‐500kg, 500‐1000kg and >1000kg. Before the dataprocessingwasstartedasmallworkshopwasheldtomakesurethatallDTUAquastaffwasestimatingthediscardcorrectandinuniformway.
3RESULTSSincetheinstallationoftheEMsystemthefisherywascarriedoutaccordingtotheskippersandvesselownersfishingplanswithoutanyinterferencebyDTUAqua.
15
Accordingtotheofficiallogbooksthevesselshaveintheprojectperiodbeenatseafor16,955hours,beenrunning561fishingtripsandconducting1,558fishingevents.Table1.Numberofhoursatsea,numberoffishingtripsandnumberoffishingoperationperves‐selsfortheprojectperiodSeptember2008–July2009.
VesselABCDEFGTotal
No.ofhoursatsea2,5472,5536,3863755121,6953,12417,192
No.oftrips13579613135124134599
No.ofhauls28716755234401243701,574
Note:1MeoniastoppedfishingbyultimoDecember2008andSøstrenestartedmid‐Marts2009.
Asdescribedinsection2.5theskipperswereobligedtofillinanextendedlogbookinadditiontotheofficiallogbook.Table2showthenumberoftripsandnumberoffish‐ingoperationcarriedoutduringthetrialperiodaccordingtotherecordingsmadebytheskippersintheextendedlogbooks.Table 2. Number of trips and number of fishing operation carried out during the trial period ac‐cordingtotherecordingsintheextendedlogbooksmadebytheskippers.
VesselABCDEFGTotal
No.oftrips13580563135119130586
No.ofhauls28749358858631193641,972
Comparingtable1andtable2thereisadifferenceinthenumberoftripsandnum‐ber of fishing operations made. This difference is caused by various reasons; i) ac‐cordingtothenationallogbookorderfishingoperationsshouldonlybefilledinonceaday;ii)changeofskippersonthevesselsandiii)especiallyforgillnetfisherywhentodistinguishbetweenonegillnetsetfromanother;iiii)justsimplyforgetfulnessinfillingintheforms.
16
AmajordifferencecanbeseenforvesselB.Thisvesselchangedskipperduringthetrialperiodandthereasonforthisdifferenceinnumberoftripandnumberisappar‐ently a miscommunication. In January 2009 the vessels changed gear from Danishseining to gillnettingforapp.threemonth.Therecordingoftheindividual fishingoperationfromanothermaybedifficultandhascausedsomedifferencesindetermi‐nation of fishing event using the official and extended logbook.In addition whendoingDanishseiningusingthesameanchoring4‐8netsetscanbemadeandinsomecasesjustonefishingoperationforallthehaulsinadayhasbeenmadeintheofficiallogbookandseveralentriesintheextendedlogbook.ForvesselCthedifferenceisprobablycausedbythatjustonefishingoperationforallthehaulsinadayhasbeenmadeintheofficiallogbookandseveralentriesintheextendedlogbookandjustsimplyforgetfulnessinfillingintheforms.ForvesselDandEithasbeenforgottenthatalsotherecordingintheofficiallogbookshouldalsobemadeonahaulbyhaulbasis.Ifavesselleavesaportforfishingthefisherhastofillintheofficiallogbook.Forgillnettersithappensthattheydonotstartfishingbecausethecurrentabovetheseabedisrunningtoofastforfishing.Inthesecasestheextendedlogbookhasnotbeenfilledin.ThereforethedifferenceforvesselFforthewholetrialperiodandforvesselBinquarteronein2009.SensordataandimageshavebeencollectedthroughouttheperiodbeginningofSep‐tember2008anduntilultimoJuly2009.Notalldatawasprocessedbythetimethisreportwasfinalisedbecausesomeoftheharddrivesstillwereonboardsomeofthevessels.Furthermore,thedataanalysesweredelayedbecauseofsoftwareandrelateddataproblems.Therefore,only81%ofthetripsoperationshavebeenprocessedandusedfortheanalysisshowninthisreport.AnupdatedreportincludingalldatawillbeissuedultimoSeptember2009.
17
Table3.Numberoftripsandnumberoffishingoperationsrecordedusingsensordatausedforthisreport.
VesselABCDEFGTotal
No.oftrips1354850323340126464
No.ofhauls28729654860591703161,736
3.1CollecteddataTheEMsystemsweresetuptobepoweredandcollectingdatafortheentiredura‐tionofeachfishingtrip.A‘timegap’isaperiodoftimewheresensordatawasex‐pected to be collected but was not. When 100% of the data is successfully collectedforatrip,acompletereconstructionofthe tripcanbecreatedusingthesensorandimagerydata.Astheleveloftimegapsincrease,thesystemlosestheabilitytomeettheprogramobjectivesasdeterminingthetotalfishingeffort,catchcomposition,andensuringcomplianceissuessuchascatchretentionandarearestrictionsarefollowed.Gapswithinthedatasetsneedtobecategorizedasoccurringwithinafishingtripornot. Since the EM data were collected after several fishing trips, some gaps are ex‐pectedinthedataset,andignoredduringanalysis,whenthevesselswereatportbe‐tween fishing trips. Time gaps can be further categorized according to the risk in‐volvedrelevanttoprojectobjectives.Forexample,timegapsthatoccurwhenfishareondeckaredeemedcritical,asthisistheperiodwhendiscardsaremostlikelytooc‐curwhilesmalltimegapsduringvesseltransitwouldbedeemedmoderate.
18
Table4.Sensordatacollectedinnumberofhours,thepercentageofdatacompletenessandthees‐timatednumberofhoursfished.
Vessel
ABCDEFGTotal
Sensordatacollected(hours)2,841.71,720.85,348.9363.4583.3526.52,550.113,934.7
Percentdatacomplete99,589,6100.099.4100.095.397.898.0
Fishingdatacollected(hours)1,908.4428.32,852.3245.0292.4210.11,554.37,490.8
Definitions:Sensor data (hours):This is the time calculated between departure and return for each trip.Percent data complete:=Sensor data hours - Time Gaps/Sensor Data hrsFishing data collected (hours):This is the time calculated between start and end for each set(as defined in No. of hauls).
3.2FishingeventanalysisSensordataregistrationoffishingevents versusfishers’extendedlogbookregis‐trationsThe EM sensor data for start of fishing events was compared with logbooks re‐cordinginordertoevaluatetheeventmonitoringcapabilityoftheEMsystem.Thedifference in minutes between recorded start of fishing event and time reported inthelogbookswerecalculatedTable5belowshowstherelativedistributionintimein‐tervalsofthedifferences.Theresultsofthiscomparisonshowthatin44%ofthefish‐ing event registrations, the time difference was less than 15 minutes. In 26% of thefishingeventsthetimedifferencewasmorethan60minutes.Thereasonforthisrela‐tivelargedifferencesweremainlyunsynchronisedwatchesandchangesfromwintertimetosummertime.Itcanhoweveralsobeduetothefishers’lackofexperienceindetailrecordingofeachfishingeventssincethisisnotanormalprocedureforthem.Oneofthefishers(vesselA)ishoweverusedtonotedowneachfishingeventssincehepreviouslyhasworkedforDTUAquaincarryingoutscientificsurveys.Thedatafromthisvesselshowsverylittleinaccuracyregardingtimeofevent.Itisthereforebelievedthatthesetimedifferenceswillbeeliminatedwhenthefishersaremoreintotheroutinesforsuchnotations.
19
Table5.Timedifferencegivenin%betweenthenotationsoffishingeventmadeinthefishers’ex‐tendedlogbookandfishingnotationnotatedusingsensordata.
VesselABCDEFGMean
<15min9525287032453944%
15‐30min127133112210%
30‐45min07812515%
45‐60min220171128171715%
>60min121341537223426%
Totalno.5725905767512681414Total2986
Table6showthedifferenceinfishingeventspositionsrecordedbyfishersintheex‐tendedlogbookcomparedwithpositionsderivedfromthesensordata.In70%oftheeventsthepositionsnotedbythefishersandderivedfromthesensordatalieswithina distance on 0.5 nm (nautical mile). For 20 % of the events the difference is largerthan1nm.Thereasonforthisdifferenceistheuncertaintyofdefinitionanddetermi‐nationofwhenafishingeventactualstartandend.Theskipperhastodoboathan‐dling when setting and hauling the gear and therefore do not have the time to re‐cordedthepositionandtimewhenthesettingandhaulingactuallytakesplace.Therecordingofpositionandtimeisthereforemadelater.Thisproblemcouldbesolvedbyusinganelectroniclogbookwhererecordingofeventsaredoneautomatically.Table 6. Distance difference given in %betweenthenotationsoffishingeventmadeinthefishers’extendedlogbookandfishingnotationnotatedusingsensordata
VesselABCDEFGMean
<0.5nm9547498981759270%
0.5–1nm2326459210%
>1nm3512571416520%
Totalno.57158893774124806102984
ImageregistrationsoffishingeventsversussensorregistrationsAnalysesvideostodeterminewhenandwhereafishingeventtakesplaceareusuallydoneasthesensordataisbelievedtodeliverthisinformation.Toverifyifthisisthe
20
case a large number of videos were analysed. In order to determine if sensor dataand video are equally precise in registering fishing events, the differences in time(Table7)anddistance(Table8)oftheregistrationsinthetwosystemswerefoundbycomparing video data with sensor data. Regarding time differences the resultsshowedthatdifferencewaslessthan15minutesin97%ofthecases(Table7).Whencomparingthedistancesnotedfromeachcatcheventthedistancedifferedwithlessthan0.5nmin86%ofthecases(Table8).Sincethetimeanddistancerecordingsfromthisexperimentisalmostidenticalandas processing of senor data is more quickly that the image analysis it was decidedjusttousesensordataforregistrationoffishingevents.Howeverifsensordataforsomereasonismissing,videodatacaneasilybeusedinstead.ItshouldbenotedthatasvesselDenteredtheprojectatalatestagenoimageshavebeenanalysedfortimeandpositionregistration.Table7.Timedifferencegivenin%fishingeventsnotatedusingsensordatacomparedwithvideodata.
VesselABCDEFGMean
<15min997698971009997%
15‐30min1901011%
30‐50min0152Notprocessed
Totalno.494139494Notprocessed
Notprocessed Notprocessed
2002%
959409Total1626
Table 8. Distance difference given in % between fishing events notated using sensor data com‐paredwithvideodata.
VesselABCDEFGMean
0.5nm997567971009586%
0.5‐1nm083120411%
>1nm11721013%
Totalno.485139494959411Total1642
Notprocessed Notprocessed Notprocessed Notprocessed
21
Imageregistrationsoffishingeventsversusfishers’extendedlogbookrecordingsThe fishing events registration using EM images was as for sensor data comparedwiththefishers’logbookrecording.Table9belowshowthat40%ofthenotationsoffishingeventsareregisteredwithaccuracylessthan �15minutes.Atotalof32%ofthe events are registered with a time difference that is higher than 60 minutes. Themainreasonforthisisasmentionedforthesensordataanalysesprobablytheunsyn‐chronisedwatcheswhenchangingfromwintertimetosummertime.Table9.Timedifferencegivenin%betweenthenotationsoffishingeventmadeinthefishers’ex‐tendedlogbookandfishingnotationnotatedusingvideo.
VesselABCDEFGMean
<15min932221Notprocessed
15‐30min12413Notprocessed
30‐450712Notprocessed
45‐60min2168Notprocessed
>60min43147Notprocessed
Totalno.392215600Notprocessed
37882740%
01318%
2005%
2603415%
3503732%
1008411Total1726
Table 10 show the difference in fishing events positions noted by fishers comparedwithpositionsfromthevideodata.In63%ofthedatathepositionsisnotedwithac‐curacyoflessthan0.5nmandin27%ofthefishingeventthenotedthedistancebe‐tweentheregistrationsarelargerthan1nm.Thereasonforthisdifferenceofmorethan0.5nmisprobablybecausewhenreview‐ingtheimagesforregistrationoffishingeventsonlytrawldoorsoutandtrawldoorsinisrecorded.Afterthetrawldoorsaresetintotheseathevesselcaneasilymakeadistanceofmorethan0.5nmbeforethetrawldoorsareonthebottom(seabed).Table 10. Distance differencegivenin%betweenthenotationsoffishingeventmadeinthefishers’extendedlogbookandfishingnotationnotatedusingvideo
VesselABCDEFGMean
<0.5nm931335Notprocessed
0.5‐1nm3224Notprocessed
>1nm48541Notprocessed
Totalno.392215598Notprocessed
881009363%
30310%
90427%
1009409Total1723
22
3.3CatchdataanalysisDiscards of codOneofthemainpurposesofthisprojectwastoexaminewhetheritwaspossibletoestimate the amount of cod discard by viewing the image recordings of the catchhandling onboard the trial vessels as well as the functionality of the EM‐system.Whentheanalysisofthediscardpractisesstarteditwasplannedtoanalyseallcatchevents.Itwas,however,realizedduringtheprojectthatitwasnotpossibletofollowthatapproachwiththeavailableresources.Itwasthereforedecidedforthegillnettertoanalyseatminimum10%ofthecatcheventandforallothervesselsatleast20%ofthecatchevents.Thetotalnumberofcatcheventsprocessedcanbeviewedintable11below.Table11:Thetotalnumberofcatcheventswhichareprocessedfromeachvessel.
Vessel ABCDEFGTotalEvents 596116810182929374Table 12 show the fishing events given in percent of situations where the imageviewereitherhadestimatedless,moreorthesameamountofdiscardasthefishers.In most cases the viewer and the fisher estimated the same amount of cod discard70%. There is however situations where the fishers have estimated larger amountdiscardthantheimageviewer22%.Iflookingmorecloselyate.g.vesselC,thereare37%caseswherethefisher’sestimateislargerthantheviewers.Thedifferencebetweentheestimateddiscardbyviewerandtheamountreportedbythevesselswasrelatedtotheamountdiscarded.Theresultsshowsthatitwasdiffi‐cultfortheviewertoestimatetheamountwhenlargenumberoffishwasdiscardedand there was a clear tendency for the viewers to underestimate discards in thesesituations.IftheselargequantitydiscardseventsareremovedfromtheanalysesthepercentagesforvesselCdropto21%Theresultshowthatimagerecordingofcatchsortingcanwithahighdegreeaccu‐racybeusedtoverifytheactualamountoffishandshellfishthatarediscardedifthecatch sorting working area onboard is arranged in a optimal way for image re‐cording.
23
Table 12. Fishing events given in percent of times where the image viewer either had estimatedless,moreorthesameamountofdiscardcodasthefishers.
VesselABCDEFGMean
Fisher<Viewer4790011
Fisher<Viewer857354908256
Fisher>Viewer112037101833
328%
6370%
522%
Totalno.5330771017919Total215
DiscardofotherfishDiscardofcodwasthemainfocusareainthisprojectalthoughwhenanalysingtheimages discards of other fish species were also noted. No analysis of this has beenmade.Viewerdatashowsthatithasbeenpossibletoidentifyotherspeciesandtoes‐timatetheirweight.
3.4AnalyzingtimeandimagequalityAfter each processing of a catch event the image viewer monitored the view timespend on the image analyses (Table 13). The view time differ from vessel to vesselandfromfisherytofisheryeg.whitefishfisheryversusnephropsfishery.Thework‐ing/sortingprocessesonboardwereverydiverse.Ifthevesselhadaconveyorbeltitwasveryeasyfortheviewertoanalysethediscards.Ifthesortingtableonboardwassmallandthediscardshutesweresmallornarrowthetimeusedtoanalysetheim‐agesincreasessignificantly.Ingeneralthemoreexperiencestheviewerwasthelesstimeneedtoanalysetheimages.Table13.Meanviewtimeinminutesusedforprocessingofcatcheventforeachofthevessel.
VesselABCDEFGMean
Meanviewtime(min)381513323182023
Total no. of catch eventsanalysed595816810182028361
Note:Totalno.ofeventsanalysedincludesalleventboththosewherecoddiscardedisrecordedandeventwherenocoddiscardhasbeenrecorded.
24
As described in section 2.5.2 the image quality was evaluated. Table 14 show thenumberof2hoursvideosequencesanalysedforimagequalitycategorisedaccordingto quality. I general the image quality was very satisfactory. See section 4.2 for amoredetails.Table14.Showthenumberof2hoursvideoanalysedforimagequalityperqualitycategory.
VesselABCDEFGMean
High(%)
Medium(%)
Low(%)0010001%
Nodata(%)0000000%
9829818315Imagequalitynotanalyzed9911000100094%7%
Total no. of 2 hourimages51222361010494301888
3.5ObserverdataanalysesAs described in section 3.4 observers from DTU Aqua participated in a number oftripsonboardthevessels.Table15isshowingthenumbersofobservertripsandthenumberofhaulssampledforspeciesdistributionandforlengthmeasurementsoftheretainedanddiscardedpartofthecatches.Table15.Numberofobservertripsandthenumberofhaulssampled.
VesselABCDEFGTotal
No.oftrips1024314630
No.ofhauls123166111655
Thetotalcatchofcodestimatedbythecrewandtheobservercanbecompared.Theobserver data represents 55 hauls whereas the total number of hauls made by thefishersis1,972hauls.Ingeneralthereisahighagreementbetweentheobservationsifthevariationbetweentheindividualhaulsistakenintoaccount.Table16showthe
25
estimatedweightofcoddiscardedandretainedperhaulsmadetheobserverandthefisher.For vessel E only one haul have been worked up by an observer and some uncer‐tainty may beexpected. Table17show theestimatedweight of cod discardedandretainedperhaulsmadetheobserverandthefisher.Table16showtheestimatedweightofcoddiscardedandretainedperhaulsmadetheobserverandthefisher.
Vessel ObserverDiscardedA8.3B2.0C0.8D9.1E0.1F0.2G3.3
Retained91.798.099.290.999,999.896.7
When having the total amount of cod retained and cod discarded recorded by thefishersthecoddiscardpercentagecanbecalculated.Table17showsthepercentagecodthathavebeendiscardedandbeenretainedonboardandlanded.Table 17 shows the percentage cod that have been discarded and been retained onboard andlanded.Thefishers’registrations.
VesselABCDEFG
Discarded3.0%2.0%1.9%9.8%12.6%1.2%3.3%
Retained97.0%98.0%98.1%90.2%87.4%98.8%96.7%
These discard rates can be compared with discard rates estimated by the standardobserverprogrammefortheperiod2006‐2008.TheestimatedofcoddiscardedfortheDanish fishers using towed gear (trawl and Danish Seine) fishing in the North SeaandtheSkagerrakhasbeenestimatedtoapp.48%andfortheKattegattoapp.53%.ForthewesternBaltictheestimateisapp.9%andfortheeasternBalticapp.8%.
26
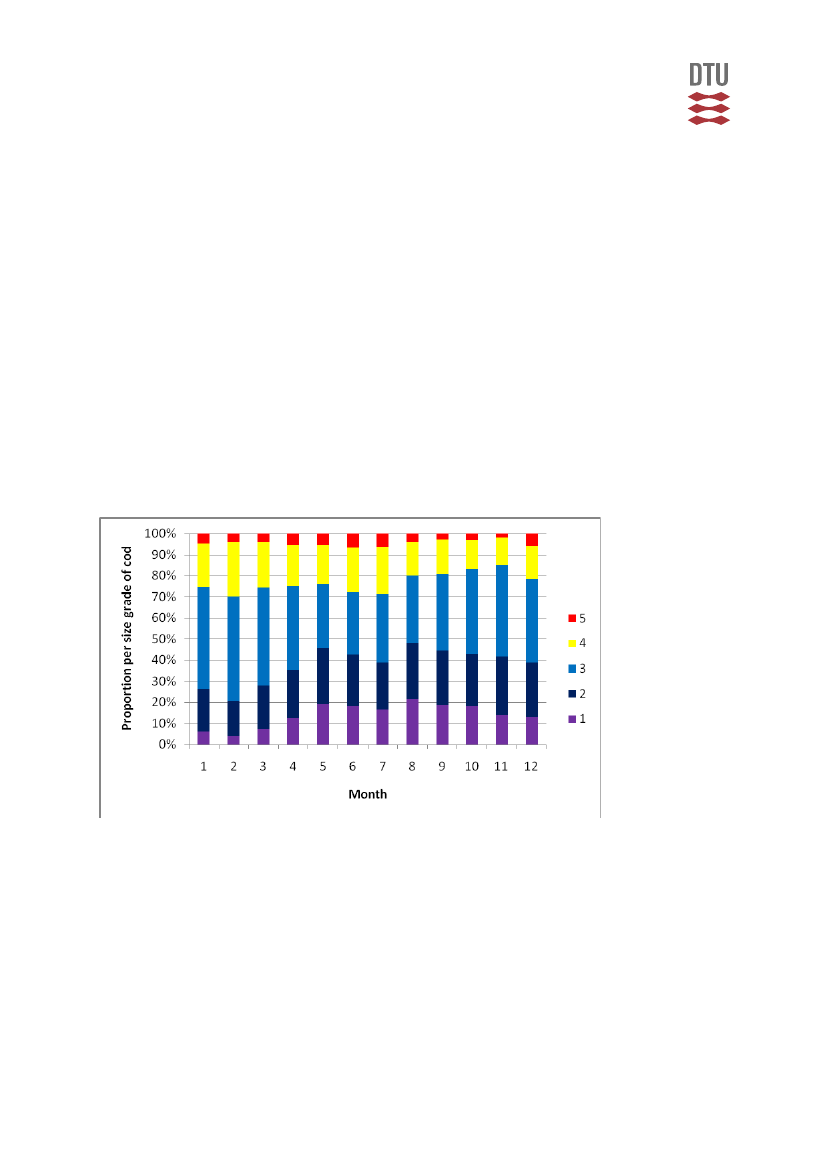
3.6LandingdataanalysisOne of the conditions for the vessels participating in the project was a ban againstdiscardingoffishabovetheminimumlandingsize.Formostspeciesthepriceperkgincreaseswiththesizeofthefishanditispossibleforavesseltooptimisethevalueofaquotabyonlyretainingthelargefishanddiscardthesmallone.Thistypeofdis‐card is normally called high grading and often occurs for species and areas wherecatchpossibilitiesandquotasdonotmatch.FourofthetrialvesselshavebeenfishingintheNorthSeaandtheSkagerrakandacomparisonbetweenthefourvesselsandtherestofthefleetfishinginthesamear‐easwasmade.Figure2showstheproportionofcodpersizegrade(sizegrade1isthelargestand5isthesmallest)permonthfor2008ofallDanishvessels(trialvesselexcluded)thathavelandedcodcaughtintheNorthSeaandtheSkagerrak.Figure3shows the proportion of cod per size grade per month for 2008 for the trail vesselsthathavelandedcodcaughtintheNorthSeaandtheSkagerrak.
Figure 2Proportion of cod per size grade per month for 2008 for all Danish vessels (trial vessel ex‐cluded)thathavelandedcodcaughtintheNorthSeaandtheSkagerrak.
27
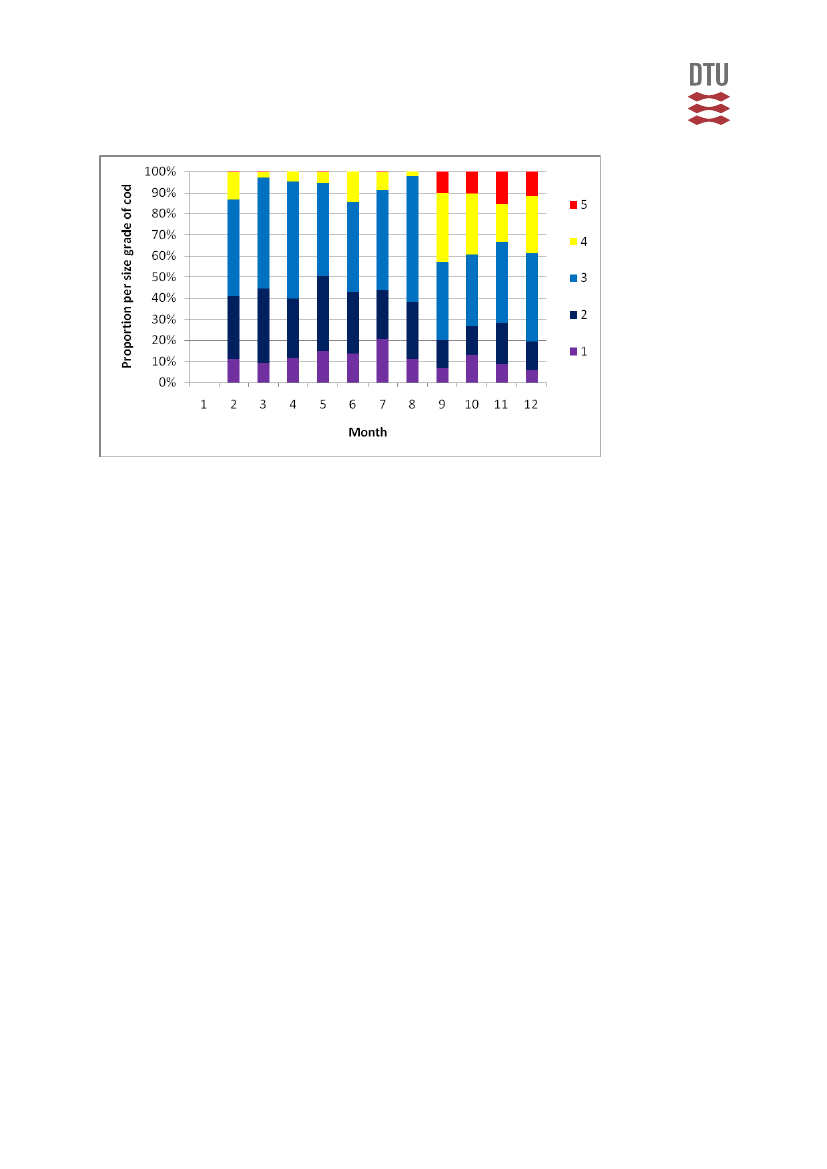
Figure3.Proportionofcodpersizegradepermonthfor2008forthetrialthathavelandedcodcaughtintheNorthSeaandtheSkagerrak.ThedataforJanuaryisnontypicalandthereforenotincluded.
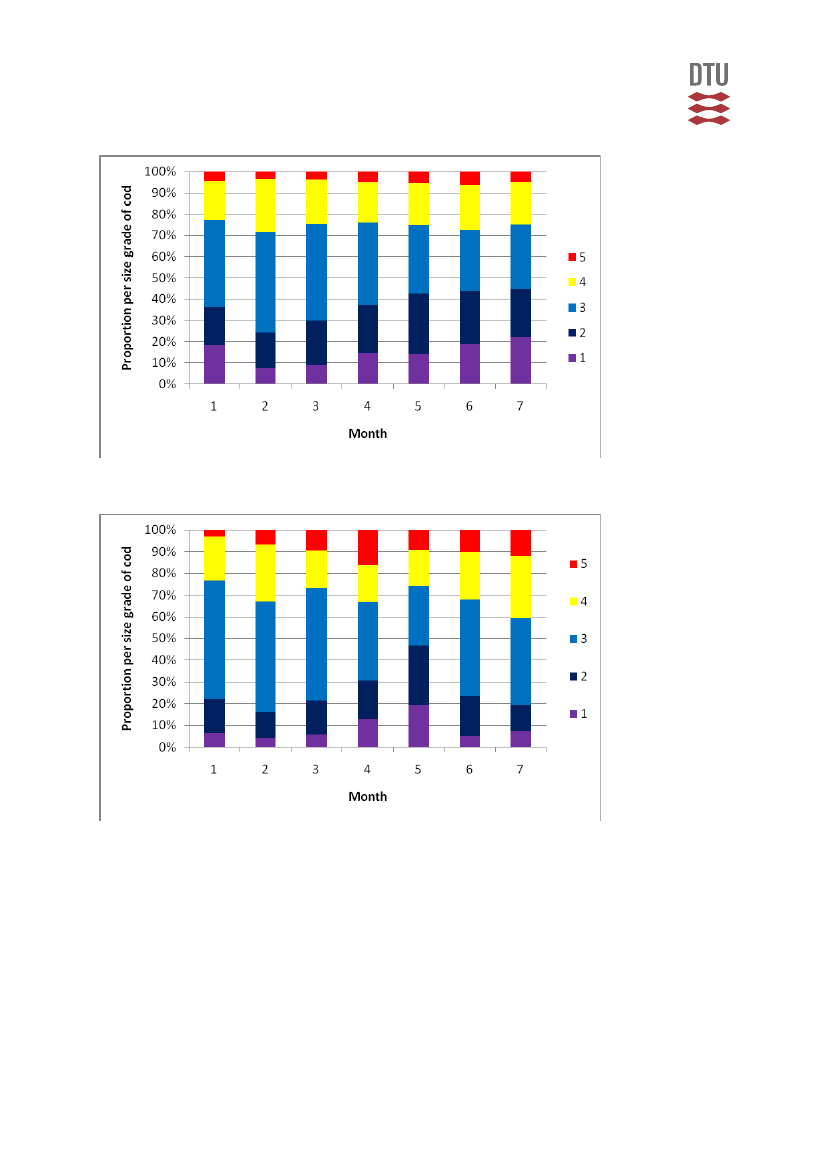
TheprojectstartedprimoSeptember2008.Asignificantdifferencebetweenthefourtrial vessels, that have been fishing in the North Sea and the Skagerrak, comparedwithothervesselsfishinginthesameareascanbeenseenforSeptember‐Decemberfor2008.Thefirsteightmonthsof2008thesizegradelandingpatternisalmostthesameforthetwogroups.Theresultindicatethatfor2008asignificanthighgradingofcodoccuredinordertooptimizetherevenueofthecodlandings.Sameanalysiscanbemadeforthefisheryinthesameareasforthefirst7monthof2009.Figure4showsproportionofcodpersizegradepermonth(January‐July)for2009 of all vessels (trial vessel excluded) that have landed cod caught in the NorthSea and the Skagerrak. Figure 5 shows the proportion of cod per size grade permonth(January‐July)for2009forthetrailvesselsthathavelandedcodcaughtintheNorthSeaandtheSkagerrak.
28
Figure 4Proportion of cod per size grade per month (January‐July) for 2009 for all Danish vessels(trialvesselexcluded)thathavelandedcodcaughtintheNorthSeaandtheSkagerrak.
Figure 5.Proportion of cod per size grade per month (January‐July) for 2009 for the trial that havelandedcodcaughtintheNorthSeaandtheSkagerrak.
Thedifferencebetweenthetwovesselgroupsforthefirstsevenmonthof2009isnotaspronouncedasfor2008.ThisdifferencemaybecausedbythesignificantincreaseoftheTACby30%forcodintheNorthSeaandtheSkagerrakfrom2008to2009.Thevesselquotasfor2009maythereforebemoreinlinewiththeactualfishingpossibili‐tiesandthiscouldhaveapositiveeffectonthehighgradingissue.
29
Eventhoughitisrecognisedthattheresultsshownforthetrialvesselsarebasedondataforfourvesselsfisheryonlythedifferenceinsizegradedistributionbetweenthetwovesselgroupsisconsiderableandgivesapictureoftwodifferentlandingprac‐tises.Basedontheseanalysesthereareclearindicationofchangesinfishingpracticesand catch handling and that discard of cod above the minimum landing size de‐creasedorwasalmostnonexistentforthevesselsthatparticipateinthetrial.Discardofcodbelowtheminimumlandingsizealsodecreasedseesection3.7.
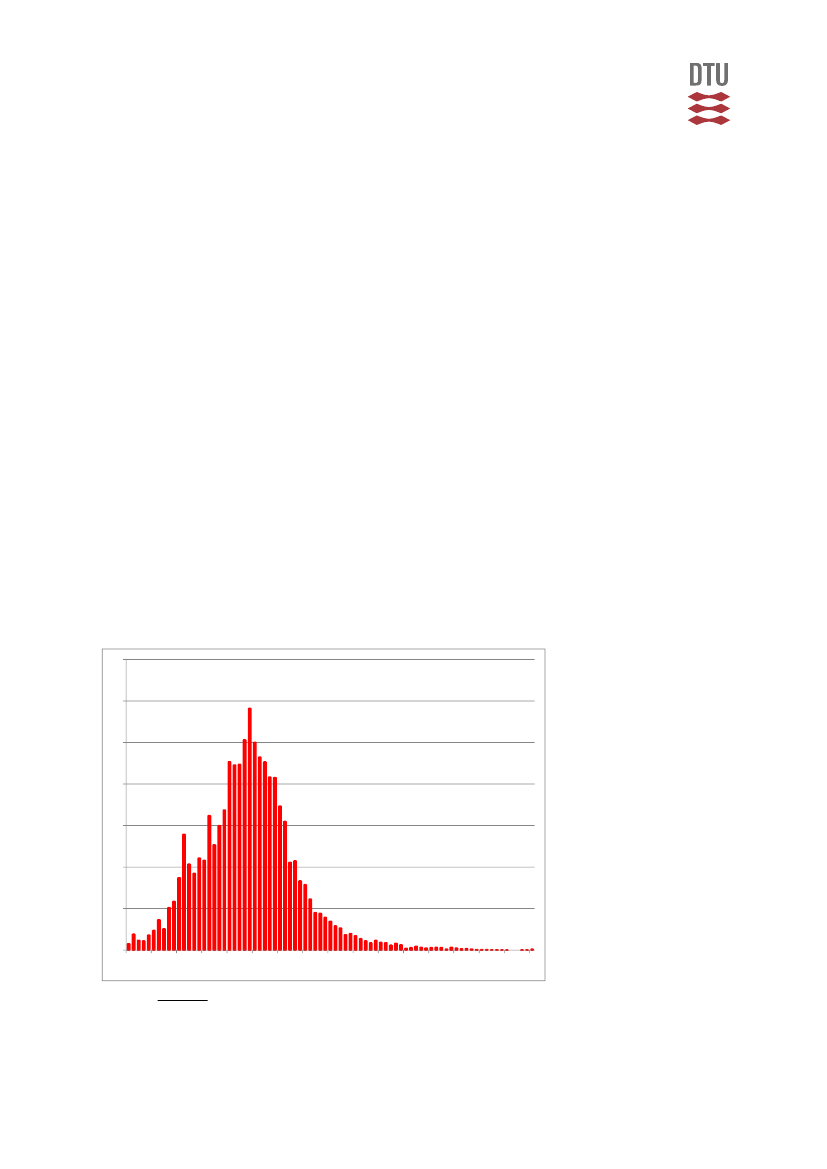
3.7 Length distributions of cod discardsOne of the requirements for the skippers and crew were that they had to carry outlengthmeasurementsofalloratleast50specimensofthecodthattheydiscarded.Acomparisonofthelengthcompositionofcodthatwerediscardedbythetrialves‐selsfishingintheNorthSeaandtheSkagerrakandtherestofthefleetfishinginthesameareawasmade.Thedatacollectedbythetrialvesselscoversthewholetrialpe‐riod(September2008–July2009)whereasthedatafromtherestofthefleetwascol‐lectedbyobserversintheperiod2006‐2008.Fortheobserverdataameanlengthdis‐tribution for three years has been calculated. It should be mentioned that the mini‐mumlandingsizeforcodcaughtintheNorthSeais35cm.andfortheSkagerrak30cm. Figure 6 is showing the relative length distribution of cod that are caught anddiscardedbyallvesselsfishinginthefishingintheNorthSeaandtheSkagagerrakintheperiod2006‐2008.7
6
5
4
3
2
1
01020304050607080+90
Figure6.RelativelengthdistributionofcodthatarecaughtanddiscardedbyallvesselsfishinginthefishingintheNorthSeaandtheSkagagerrakintheperiod2006‐2008.
30
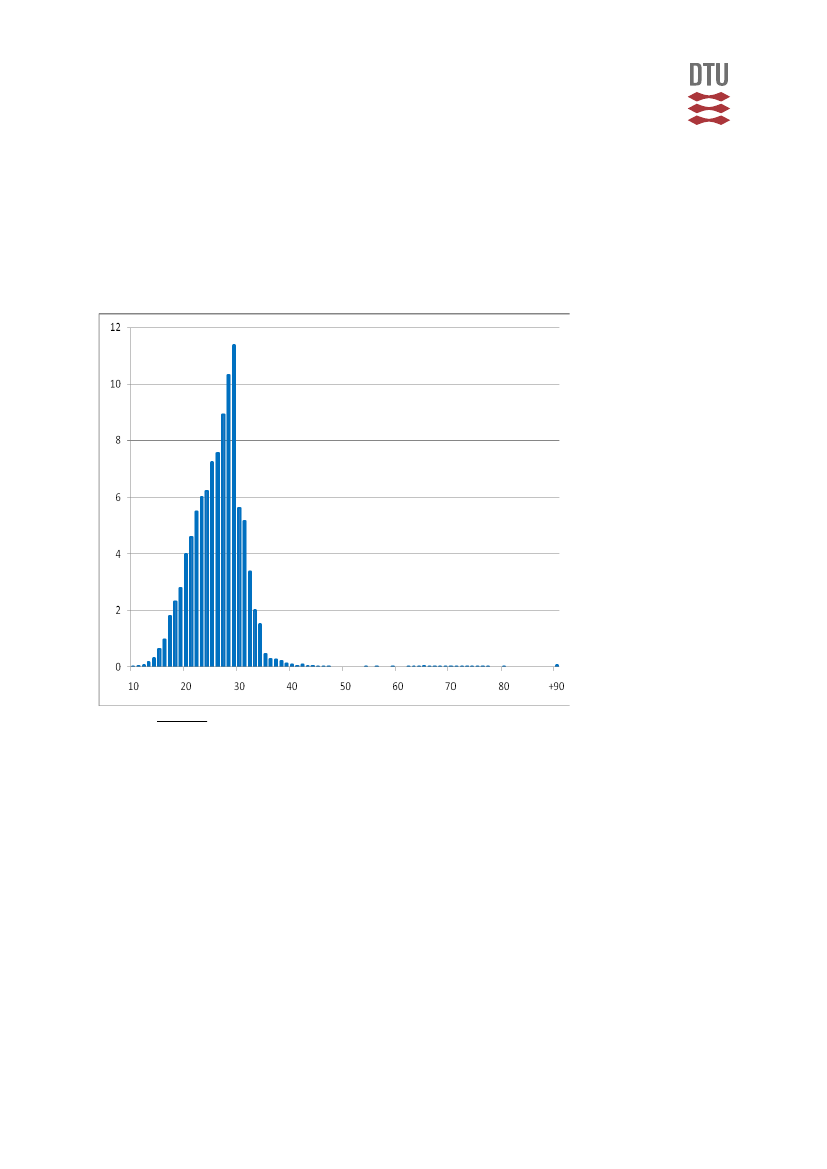
It can be seen that cod above the minimum landing size has been discarded. Thisdiscardpatterncanbecomparedwiththetrialvesselsthathavebeenfishinginthesamearea(NorthandtheSkagerrak).Figure7showstherelativelengthdistributionofcodthatwerecaughtanddiscardedbythetrialvesselfishingintheNorthSeaandtheSkagagerrakintheperiodSeptember2008toJuly2009.
Figure7.RelativelengthdistributionofcodthatarecaughtanddiscardedbythetrialvesselfishingintheNorthSeaandtheSkagagerrakintheperiodSeptember2008toJuly2009.
Eventhoughtthedatapresentedinfigure6andfigure7donotcoverstheexactsameperiodthepictureshowninthetwofiguressupportstheresultsoftheanalysismadeonthesizegradedistributionofthelandingsdescribedinsection3.6.DiscardoffishbelowtheEUminimumlandingsizeismandatory.
4DISCUSSION4.1EMsystem‐hardwareTheEMsystemsweredeployedonsixdifferentvesselsandundersixdifferentenvi‐ronments in terms of dust, heat, cold and humidity. Furthermore, power supplieswere different from vessel to vessel and not always stable and power failure hap‐penedanumberoftimes.DespitetheseconditionstheEMsystemdevelopedbyAr‐
31
chipelagowasworkingincrediblywell.Duringthedatacollectionperiod11months(September2008–July2009)onlyonecontrolboxbrokedownbecauseofaninter‐ruption of a file (software failure) and one camera failed due to water because thecrew washed it using a high pressure cleaner. During the installation of one of thesystemacablebrokeandatonevesselelectronicinterferencecreatedsomeproblems.
4.2ImagedataThemainconceptssurroundingtheimagedatainterpretationistoensurerecordingof videos that gives clear images which can be used verify fishing operation andcatch handling. In order to ensure that the concept for camera setting used for thisprojectcanbeusedforfutureelectronicmonitoringinDanishfisheries,asampleda‐tasetforthisprojecthasbeenanalyzedbytrainedstaffatArchipelago.Section4.2of‐fersexamplesofusefulwaysforanalyzingthevideoimagedata,andoffersinsightintonecessarychangestocameraconfigurationsandcrewbehaviorinordertohelpimproveimagedataanalysisandinterpretationtoapplytotheremainingdataset.
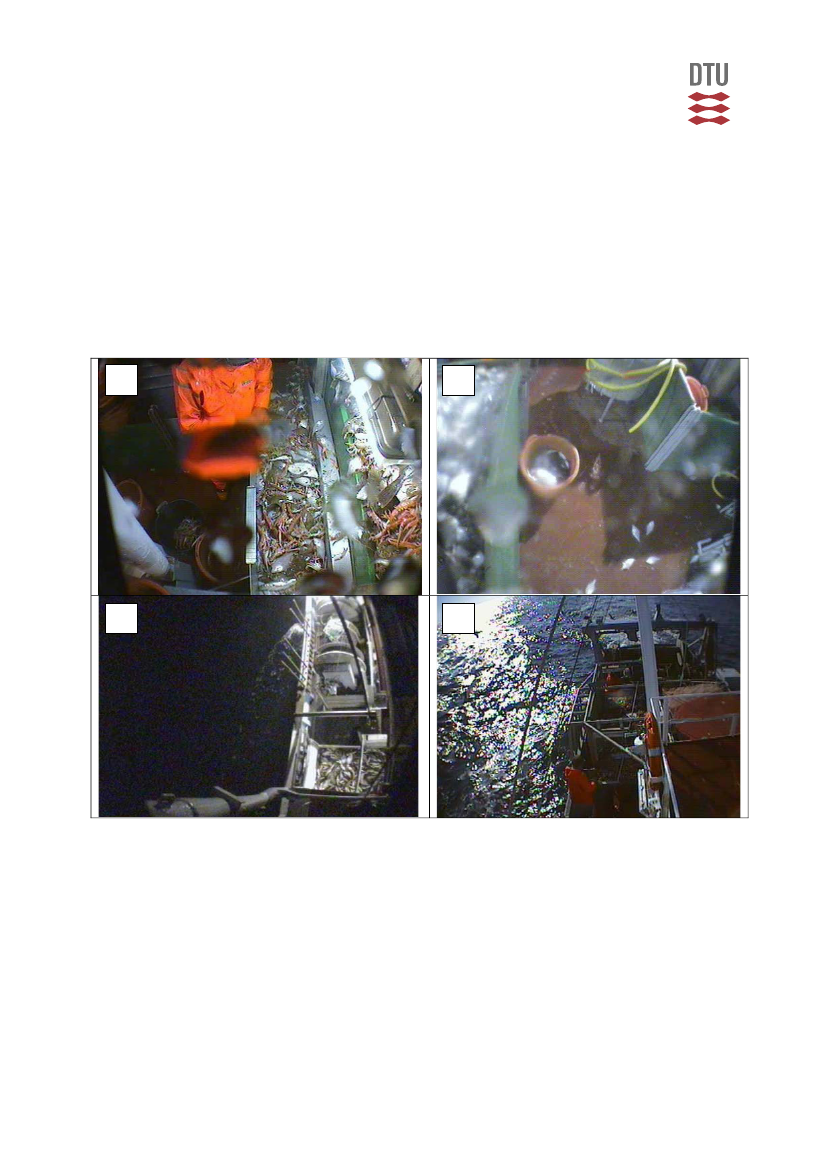
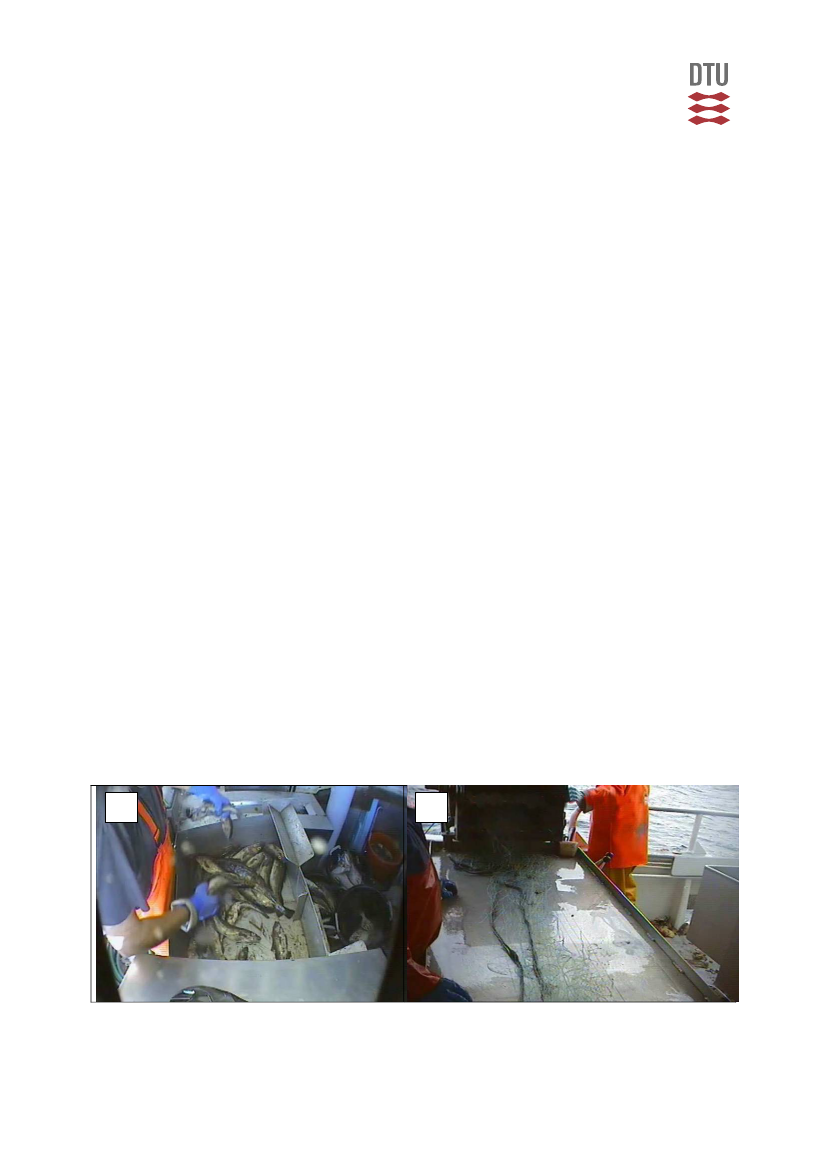
Sample image data from the six participating vessels was reviewed by staff fromArchipelago to assess the feasibility to monitor for the project objectives using EMsystems.ImagedatawasreviewedusingVideoAnalyzeratplaybackspeedsrangingfrom1.5timesrealtimeto4timesrealtime.TheArchipelagoEMviewermadede‐tailednotesregarding:thecameraconfigurations,imagequalityandtheabilitytoas‐sessfortheprojectobjectives.TheEMviewerreviewedtheimagedatafromeachofthetripsprovided,butdidnotrecordanycatchspecificdataduringanalysis.Sampleimages of the different camera views and varying image data quality were takenfromtheparticipatingvesselsandaredisplayedinthefollowingsections.Aspartofimagedataanalysis,everytowisratedforimagequalityandusabilityasdescribed in section 2.4.2. Image data quality is assessed as an average across allcameraangles,whileusabilityisdeterminedbasedonspecificmonitoringobjectives.EffectofimagequalityImagequalitycanbeaffectedbyanumberofdifferentfactorsincludingmoistureinthe lens, sun shield blocking view, water drops, low light conditions and bad sunglare.Figure8showssomeexamplesoflowqualityimagedatafromtheparticipat‐ingvessels.ImagesAandBshowviewsofthecatchsortingareawithreducedimagequality due to low light conditions at night and water on the lens. Image C showslow light conditions during a night trip, while image D is an example of bad sunglare.Lowimagequalitycansignificantlyincreaseviewingtimewhenidentification
32
of catch was very difficult and discarding events were hard to detect. Image dataqualitymaybereducedtoalevelinwhichitisnolongerusable.ForexampleimageBinFigure8isunusableforidentifyingcatchinthesortingarea.Cleaning the lens on a regular basis can help reduce water drops and ensuring thesunshieldisnotblockingthefieldofviewduringregularservicescanhelpmaintainhigher image data quality. In addition proper deck lighting during night hauls canhelpalleviatetheproblemoflowlight.AAB
C
D
Figure8.Imagesfromtheparticipatingvesselsshowingexamplesoflowqualityimagedata.ImagesAandB‐Lowlightconditionswithwateronlens,C‐Lowlightconditionsofanighthaul,D‐Badsunglareagainstthewater
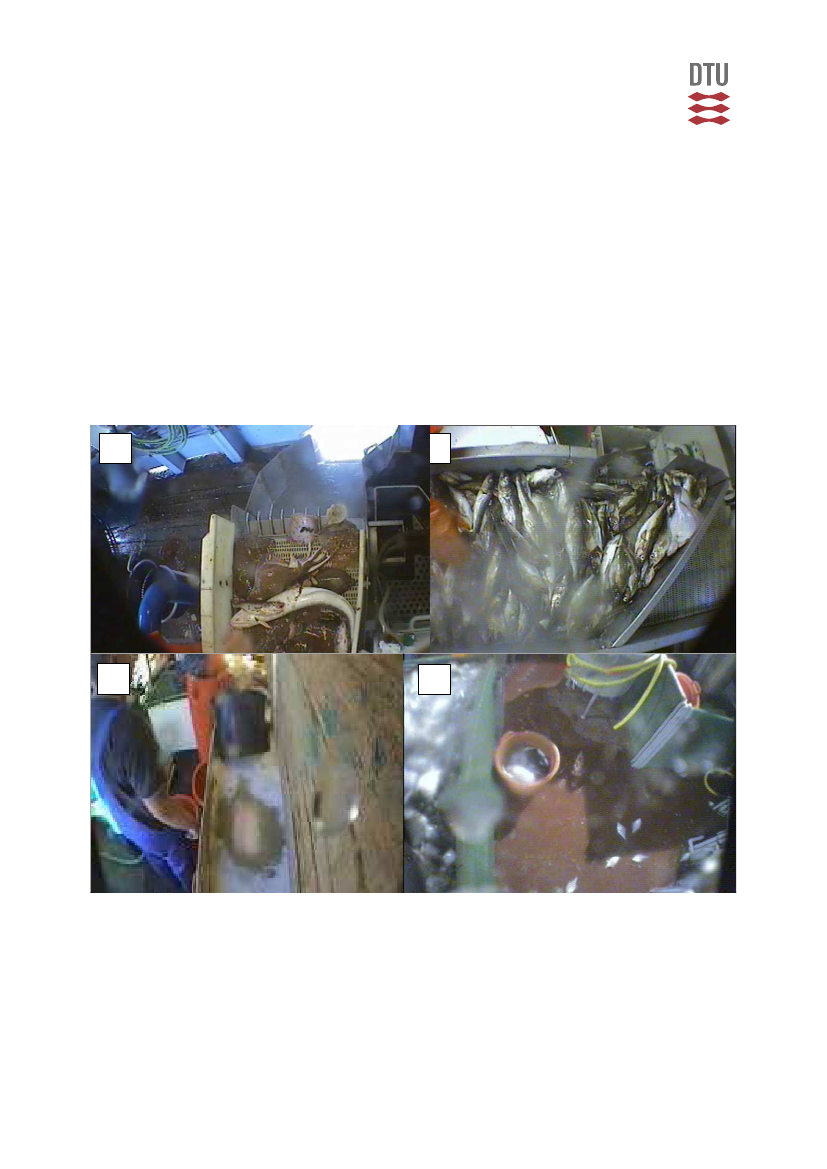
CatchcompositionImagesAandBfromFigure9showcameraviewsfromtwooftheparticipatingves‐selsthatwereusedforcatchidentification.Speciesgroupssuchasskates,roundfishandinvertebratescouldeasilybedistinguishedusingthesecameraangles;howeveridentificationtothespecieslevelwasmoredifficult,thereforegeneralspeciesgroup‐
33
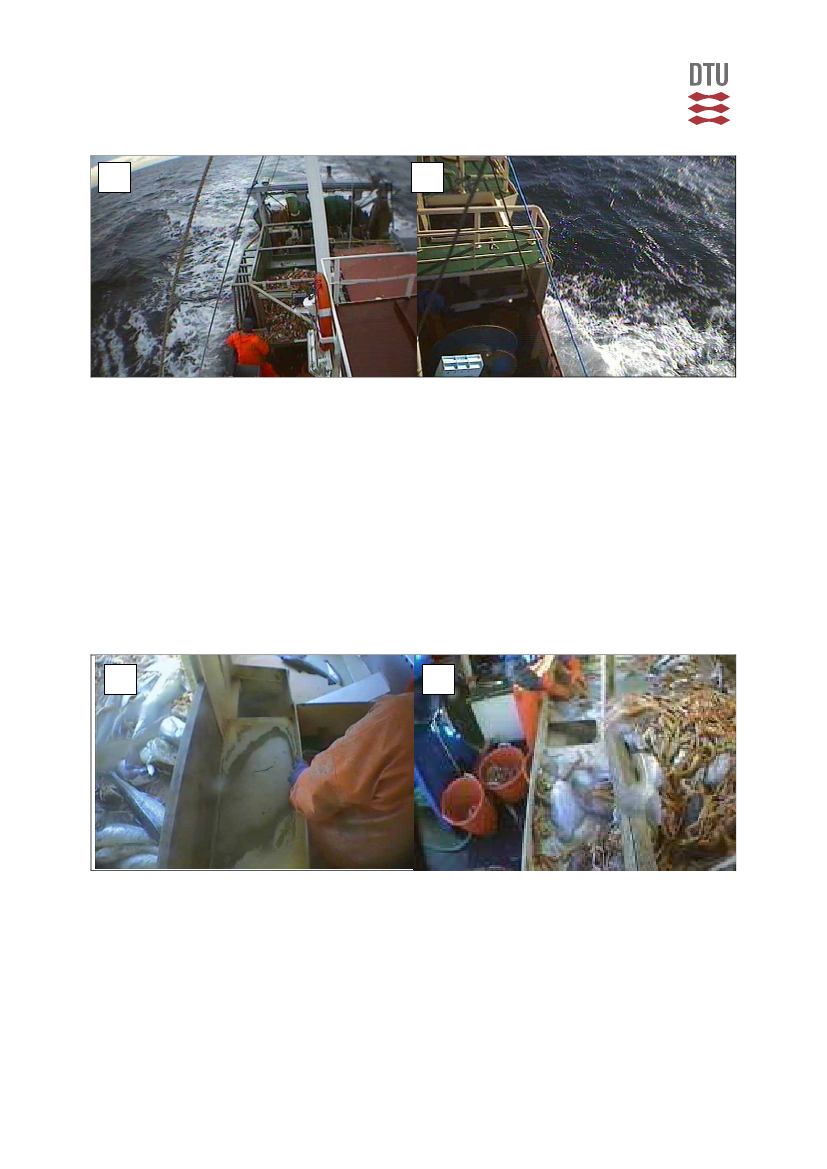
ingsmayneedtobeused(i.e.Flatfishgeneral).ImageCisanexampleofacameraviewinwhichidentificationofcatchwasnotpossible.Thecrewmembersortingthecatchwasobstructingtheviewofthecatchandwaslocatedveryfarawayfromthecamera.Inordertoimprovethisview,thecamerashouldhavebeenplaceddirectlyabovethecatchsortingareaandlookingdownonthecatchtoprovideabetterviewforidentification.ImageDisanotherexampleofacameraset‐upthatwasverydiffi‐cult to use for identifying catch. The field of view was only capturing part of thecatchsortingareaandwasprimarilyfilledwithunnecessarydeckspace.Tohelpim‐prove this view the camera needs to be shifted upwards and towards the sortingarea.Withappropriatecameraangles(seetopimagesofFigure2)itwasfeasibletoidentify catchtoeitherthespecieslevelorgeneral species groupings within this fi‐shery.AB
C
D
Figure 9.Sample images of good (A and B) and poor (C and D) camera views for identifying catchfromseveraloftheparticipatingvessels.
DiscardingoffishandshellfishInordertoproperlyassessfordiscardingofcatch,theEMviewerneedstobeawareof all discard points on the vessel. Frequently crew will discard catch from several
34
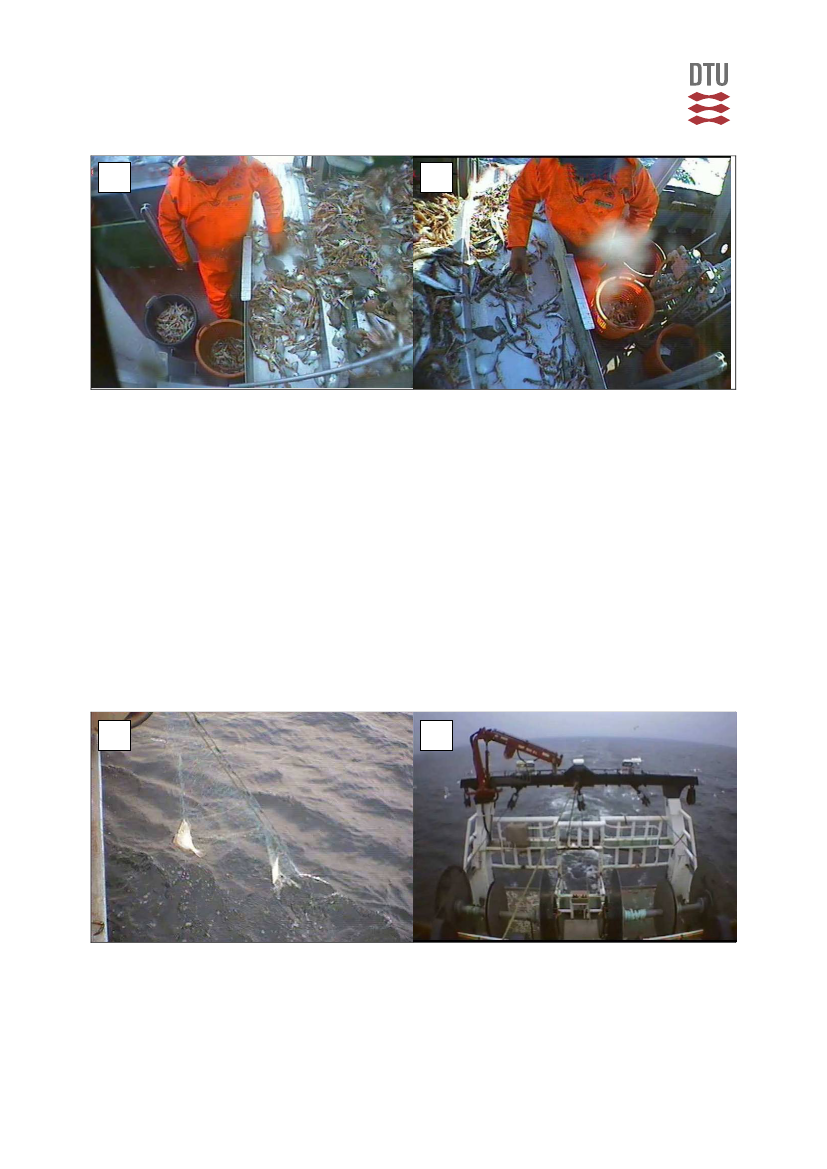
differentlocationsandasinglecameraviewdoesnotcaptureallthediscardsoccur‐ringoffthevessel.Severalofthevesselscameraset‐upsprovidedappropriateviewsofthediscardpointsoffthevesselandcanbeseeninImagesAandBfromFigure10.ForbothvesselsthecameraviewsshowninFigure10aretheonlypointsofdiscardmakingtheviewsidealforassessingthediscardedcatch.However,forsomeofthevesselsthecameraviewsdidnotproperlycapturethedis‐carding events making identification of discarded species very difficult (see Figure10).ImageAfromFigure10showsthesortingareafromoneoftheparticipatingves‐sels and a crewmember can be seen sorting catch into the discard shoot located onthefar‐handside. Howeverthenature in whichthecrew discardedthecatch awayfromthecameraviewmadeidentificationdifficult.Thisproblemcouldbesolvedbymovingthecameraclosertowardsthelocationofthediscardshute,morespecificallymoving it directly above and looking down on the sorting area and discard shute.Whenplacingcamera’saboveasortingareaitiscriticalthattheviewremainscloseenoughtoallowforidentificationofcatch.Thefurtherawaythecameraismovedtheresolutionwilldecreasemakingidentificationincreasinglymoredifficult.ImageBofFigure10showsagoodviewofthenetcominginwiththecatch,howeverthecrewmemberwillthrowdiscardsovertherailofthevessel.Thecameraviewwaslocatedsuchthatthecrewmemberobstructsthefieldofviewofthecatchbeingdis‐carded.Thecameraneedstobemovedclosertotherailandangledtolookdownonthecrewmembersotheviewisnotobstructed.ImagesCandDinFigure10aredeckviewsofthediscardpointsfortwooftheparticipatingvessels.Whiletheseviewsaregoodforseeinganylargediscardeventsitisnotpossibletoidentifyanycatchbeingdiscarded and therefore closer angles would be more appropriate for identificationpurposes.AB
35
C
C
Figure 10. Sample images of poor camera views for assessing discarded catch, Images A and B arecloseupviewswithcameraanglesthatmakeestimatingdiscardsdifficult.ImagesCandDareover‐viewanglesofdiscardpoints,howeveridentificationofcatchisnotpossiblefromtheseviews.
CDMultiplesortingpointsFrequentlyvesselwillhavemultiplecrewmemberssortingcatchatasingletime,andFigure11showsexampleimagesofthisfortwooftheparticipatingvessels.ThetopimagesshowtwoseparatesortingpointsforonevesselandinorderforanEMim‐ageryviewertoassessfordiscardingofcatchtheseviewswouldneedtobereviewedseparately. The same applies for the bottom two images showing multiple sortingpointsfor oneofthe vessels.WhentheEMviewerisrequiredtoreviewindividualcamerasseparatelythisprobablydoublethetotalviewingtimeforasingletrip.
A
B
36
C
D
Figure11.Exampleimageryfromtwooftheparticipatingvesselsofmultiplecatchsortinglocations.ImagesAandBshowtwosortinglocationsforoneoftheparticipatingvessels.ImagesCandDaretwoseparatesortinglocationsononeoftheotherparticipatingvessels.
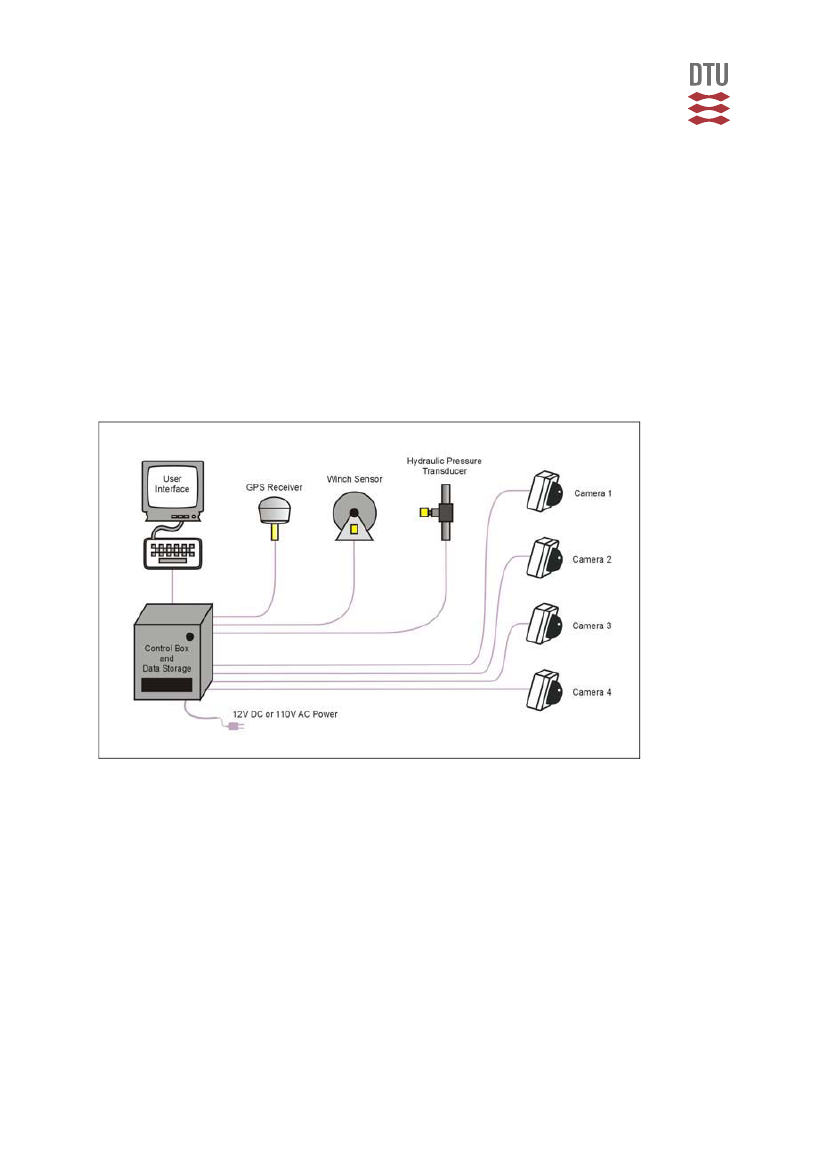
BNetcomingondeckCamera views were also set up to monitor the nets coming on deck and Figure 12provides examples of this view from two of the participating vessels. Image A is agood view of the net coming in and drop‐offs or discard events can be identified.Catchcanbeidentifiedtoageneralspeciesgroupingusingthiscameraangle,how‐ever identification to the species level would be very difficult. Image B shows anoverview angle off the stern of the vessel, however the field of view is obstructedfrombeingabletoseethenetcomingonboard.Acameraplacedattheverysternofthevesselwouldprovideabetterviewofthenettoallowforassessmentofanylargediscardevents.A
B
Figure 12.Example images from two of the participating vessels for monitoring the net coming ondeckinordertoassessforanydiscardingofcatch.ImageA‐goodviewofnetcomingondecktoas‐sessfordiscards.ImageB‐Poorviewforseeingthenetcomingonthesternofthedeck.
37
SummaryonimagedatainterpretationAsdescribedaboveandbasedonexperiencegainedduringthisprojectitisofout‐mostimportancehowthecameraplacementismade.Whenthistrialstartedandthecameraswereinstalleditwasdecidedthatnomajorchangesofthevesselsshouldbemadeinordertominimizecosts.Thelessonlearned hasshownthatchanges orin‐stalmentextralightningorextraplacestomountcamerashavetobemadeatvesselusing electronic monitoring systems. Therefore, certain minimum requirements forvesseldeckinteriorlayouthavetobesetinordertooptimizethequalityofthevideorecordingsandtoensurethatnothingcanbediscardedoutsidetheviewofthecam‐eras.
4.3SensordataThepurposeofsensordatainterpretationwastodeterminethespatialandtemporalparameters for the start and end of each fishing trip and event. Therecording fre‐quency of one record per 10‐second interval, therefore sensor data provide very finescale resolution of vessel activity during the fishing trip. The complete sensor datarecordforamonthfishingtripcaneasilyexceed450,000records.Aspecializedsoftwaretoolsisneededtomanageandinterpretthedataefficiently.Itisusefultothinkaboutwhatisthemostadequatewaytogetanoverviewonhoweachvesselcarryouttheirfishinginorderevaluatewhetheralldataiscollectioninanoptimalway.Therefore,itshouldbeconsiderationonhowharddrivechangeorservice events can improve the data collection (i.e. were camera angles changed orsensor thresholds adjusted at each vessel visit) as this would have a significant im‐pactonthedataanalysisresults.Inthisproject,EMdatawascollectedafterseveralfishingtripsweremade.Thus,foreachEMdatasettherewereseveralindividuallandings.Interpretationwasdoneforeach data set as a unit, resulting in several ‘departure’ and ‘return’ entries for eachdataset.Fishingeventswerenumberedchronologicallyfortheentiredataset.Whenenteringmultipledeparturesandreturns,itisimportanttoenterbothforeachtrip.Whenthetotalsfordeparturesandreturnsdonotmatchforagivenworkordernumber, this causes problems with trip definition, trip counts, trip durations andtimegaps.Furthermore,ifthedepartureorreturnpointisunavailableduetoatimegap(i.e.vesseldidnotturnonpoweruntilreachingthefishinggrounds),itisimpor‐tant that the first or last point available should be entered. Not all start/end eventsentered during this study and this have caused some confusion when defining thestartandendofeachtrip.
38
Itcanbeconcludedthatitisveryimportantthatthecontrolboxispoweredbeforeleavingportandthattheboxnotisturnedoffbeforeenteringintoport.InadditionuseofanE‐logbookwheredate,timeandpositionautomaticallyisrecordedjustbypressingakeyatthekeyboard.Thiswouldeasethevalidationofthefishersrecord‐ingintheE‐logbookandthedeterminationofafishingeventusingsensordata.
4.4 Fishers involvementFromthebeginningoftheprojectclosecontactanddialoghasbeenachievedwithallparticipatingskippersandvesselowners.Meetingswherepreliminaryresultandex‐perienceshavebeenpresented,discussedandcommentedhavebeenheldandveryvaluable information has been exchanged which have given close cooperation andunderstandingfrombothsides.The main reason for the fishers to participate within the project was generally toshow that the fishery do not have as large amount of discard as they often are ac‐cusedfor.Hencetheassignmentofincreasedcatchopportunitiesofcodwasanim‐portantincentivefortheirparticipation.Beforethefisherscommittedthemselvestotheprojecttheirmainconcernsrelatedtotheethicalproblemsaboutbeingmonitoredandthecrews’reactiontothis.Howevershorttimeaftertheprojectstartedthecrewaccepted being video monitored and did not find it problematic or disruptive fortheirnormalworkingprocedures.Closetotheendoftheprojectthefisherswereaskedtofilloutquestionnairestogivetheirviewsonseveralissues.Theywereaskediftheyhadbecomemoreawareofthecatch composition and the discard volume and if they did something actively toavoiddiscardcomparedtopreviouspractices.Mostofthefishershavebecomemuchmoreawareoftheamountofsmallcodcom‐paredtoearlierpracticewhereasothersthoughtthattheywerejustasawareasbe‐fore.Theyhadhoweverbeenveryattentivetoensuretheyhadavailablequotasforlandingcodaswellforotherspecies.Regardingavoidanceofsmallcodsomeofthefishershadchangedtheirbehaviourintermsofchangingfishinggroundiftheyinanarea observedmanysmallcodtheyhadin somecases switchedarea, gear ormeshsizetoavoidthem.Oneofthemostpositiveoutcomesfortheparticipatingfishershasbeenthepossibil‐ityofnowbeingabletodocumentwhatistakingplaceatseaandthatnotallfisher‐
39
ieshavehighdiscardrates.Themostnegativehadbeennegativeattitudesfromcol‐leaguesandthefishers’sorganisationduringthebeginningoftheproject.Itshouldthoughbementionedthatthenegativeattitudebythecolleaguesnotparticipatinginthetrialandbythefishers’organisationhaschangedtobeneutralorevenpositiveandanunderstandingthatfullydocumentedfisherycouldbeabenefitfortheindi‐vidualfisherhasemerged.Thefisherswhohaveparticipatedintheprojectseeafullydocumentedfisheryasthefuture and a welcomed opportunity if such a system is introduced as a voluntaryschemeforalltypesoffisheries.Theyconsideracertaindegreeofincentiveintermsofincreasedfishingopportunitiestobecrucialandifthepremiumislessthanapp.20%thefishersdoubtthattheschemewillbeinteresting.Iftotalcatchesofmorethanonespeciesshouldbefullydocumentedandcountedagainstthevesselquotasomelimits for the number of species have to be set as extra sorting and recording taskswillbealimitingfactor.Practicalissuesastherequireddeckspaceforhavingalargenumbersofbasketsusedwhensortingthecatchintospeciesmayinmanycasesbeaproblem as well as the safety issue by having that many baskets “flying round” inbad weather. However if electronic reporting tools were introduced this could re‐ducesomeoftheextraworkrelatedtothefullydocumentedfisherytasks.Thefisherswerealsoaskedwhethersomespecificrulesinthepresentfisheriesman‐agementregulationwereespeciallyburdensomeandtotheiropinioncouldbeelimi‐natediffullydocumentedfisherywasimplementedasanoption.Therewasagen‐eralagreementthatthehailssuchasformanagementarea shift, departure, andac‐tive–passivereportingcouldbeavoidedastheEMdatacouldbeusedtocheckthisinformationifneeded.Anotherimportantissueistheyeartoyearquotaflexibility.Ifabonusforparticipat‐inginfullydocumentedfisheryisgiventhisbonusmaybeestimatedbasedonhis‐toricaldata.Ifabigyearclassofaspeciesisenteringthefisherythereisahighriskofcatchingasignificant amountofundersizesfish–whichshouldbecountedagainstthequota–thatcouldresultinreducedrevenueforthefishersandabadutilizationof the stock. Therefore, a more flexible year to year flexibility is needed in order togivethefishermananincentivetopostponethecatchesuntilthefishhasanaccept‐ablemarketablesize.Suchflexibilitycouldalsoformanimportantselectivemeasurepostponingfisheryuntilsizecompositionsareoptimalinrelationtotheresourceandthefishers’economy.
40
4.5EMandsurveillanceperspectivesTheDanishDirectorateforFisherieshasmadeafirstassessmentonwhethersomeofthe current fisheries management rules could be deleted or be changed if a fisherymanagementsystemwasbasedonʺfullydocumentedfisheryʺ.Afirstassessmentonthestrengthsandweaknessesofthecurrentsetupoftheelectronicmonitoringexpe‐rimental system and whether it could be used for surveillance purposes were alsoconducted.ThetextbelowisthereforeafirstopinionsandcommentsandmaynotberegardedastheDanishDirectorateofFisheriesofficialopinionasfurtherdetailedas‐sessmentneedstobemade.Thesystemsetupcanbothcontributetobetterandmorereliableinformationondis‐cards but also contribute to; 1) higher reliability regarding landings being countedagainstthequotaintherelevantmanagementareas;2)thatthepermittedfishingef‐fort(kW‐days/daysatsea)isrespected;3)thatnoʺunauthorizedʺlandingsoccursinport;4)andtoincreasetheefficiencyofthecontrol.GenerallyitisassessedthattheEMsystemwouldworkoptimalifcombinedwiththeuseofelectroniclogbook.Aprerequisiteforoptimaluseisacamerasettingthatin‐cludes image recordings of the whole working deck including the unloading hatchareaandthatthesystemisoperativeduringdocking/unloading.Implementation of a fully documented fishery management system could probablyreplacerulessuchastheonesondeparture/arrivalinportandentering/departureoffishing area. Similarly the system could justify that the requirement for unloadingwhen entering harbor was repealed.However if the system should replace theserules it is required that the hardware is of high quality and that the fishers are re‐sponsibleforitsfunctioning.Furthermore a full documentation of all catches would make the effort limitationschemesobsolete.IfthesystemisusedtogetherwiththeE‐logbookthatisrecordedonahaulbyhaulbasisandtheretainedanddiscardedpartofthecatchwhereestimatesofweightbyspecies is recorded and a functioning VMS it is possible that the prohibition on fi‐sheryinvariousregulationareasandthenationalrequirementsonmanagementareashiftreportingcanbeeliminated.
41
Theroleoffulldocumentationensure,thatallcatchesareaccountedforbyweighingall discards and by ensuring that no other amount disappears before the catch islandedandweighed.Registrationofthecatchweigh–otherthantheamountofcoddiscardedhasnottakenplaceonboardduringthistrial.SpecificpresentEUrulesthatmightbeeliminated:Council Regulation no. 1098/2007 (Article 13, 16 and 17). Council Regulation no.43/2009TAC‐quota,annexIIA,art.13.CouncilRegulationno.676/2007,art.10.Na‐tionalRegulationno.1359from19.December2008§22.Ifallthepresentregulationsareexaminedmorethoroughlythereareprobablymoreprovisionthatcanbeeliminatedorexceptionforthoseprovisioncanbemadeinali‐censeforfullydocumentedfishery.
4.6CostissuesEstimatedcostsforvariestasksduringthisprojectcanbepresentedasfollows:PurchaseofoneEMsystem:app.€5,500.‐Installmentonboardpervessel(2mandayspervessel):app.€1,200.‐Consumables,blacksmithandotheritemspervessel:app.€1,500.‐Maintenanceofthesystempervesselperyear:app.€100.‐Exchangeofharddrivespervesselperyear:app.€1,000.‐Analysisofsensordatapervesselperyear:app.€3,000.‐Analysisofimagespervesselperfishingevent:app.€20.‐Itisobviousthatthemoretrainedstaffthatisworkingonsensordataanalysisandimageryviewingthelowerthecosts.Furthermore,themoreautomaticthesoftwareusedaremadethelowerthecosts.Itshouldalsobeevaluatedwhetherallorjustasubsetoftrips/eventsrandomlyselectedwouldbesufficientifelectronicmonitoringisimplementedforsurveillancepurposes.
5CONCLUSIONSANDRECOMMENDATIONSThe electronic monitoring system has proven its functioning. The EM system usedduring this trial has worked incredibley well and only minor technical problemshave been encountered. Overall data from more than 10,000 hours at sea time hascollectedwithadatalossoflessthan2%whichconfirmthesystemsreliability.
42
GenerallyiscanbeconcludedthatElectronicMonitoringcanbeusedwithasignifi‐cant accuracy to verify how, where and when a fishery is carried out and to verifythecatchcompositionanddiscardpracticesandamounts.ThecostsforverifyingavesselsfisheryusingEMissignificantlowerthanobtainingthesameinformationbyusinghumanobserversonboard.Analysishaveshownthatinmeanlessthanonehoursdataanalysisandimageviewingshouldbeusedforve‐rifyingonefishingeventandtheassociatedcatchhandling.Itshouldbementionedthoughthatifbiologicalinformationhavetobecollectedithastobecarriedoutei‐therbythefishersorbyanobserver.Theanalysisofthedatacollectedbythesensors(GPS,hydraulicpressureandrota‐tion of the winches) show that determination of where and when a fishing eventtakesplacecanbemadewithahighdegreeofaccuracy.Inadditionbyviewingtheimagesitcanbedeterminedwhetherthefisheractuallyisfishingorjustcleaningthenet.Therefore,areamisreportingofcatchescanbeeliminated.By viewing images from the catch handling onboard an estimate of the total catchamountandthespeciesdistributioncanbemade.Thefocalpointforthisprojecthasbeendiscardsofcod.Experiencegainandtheanalysishaveshownthattheestimateofdiscardsofcodbyviewingtheimagescanbemadewithsignificantaccuracy.Es‐peciallyifthevesselarehavingasortingconveyorbeltwherethediscardedfisharepassedthediscardshuteindividually.Iflargeamountsofdiscardsoccurtheaccura‐cy of the estimate of the discard amounts degreases unless specific obligations forcatchhandlingarefollowed.Implementationofelectronicmonitoringasaprerequisiteforfullydocumentedfish‐erywillprobablyrequirethattheindividualfisherenrolthesystemonavoluntarybasis, in order to ensure legitimacy of the documentation and in order to have thefisheracceptthe“burdenofproof”,thusensuringamorecomfortablelegalpositionincasesofinfringement.ThelevelofselfinterestfromthevesselstronglyaffectsthereliabilityofEMasareliabletoolfordocumentingcatches.Furthermoretheimple‐mentationandrunningofthesystemneedsaclosecooperationbetweentheindustryandtheauthoritiestoensuremaximumdatasecurity.Theexperiencesobtainedduringthistrialhaveshownthatanelectronicmonitoringsystem such as the one used during the present trial can be applied on almost alltypesofpelagicandthevesselsfishingforsandeel,sprat,bluewhitingandNorway
43
poutandnewerdemersalfishingvesselsandgivea100%documentationofthefish‐ingactivities.Onboardothervesselsitmaybenecessarytomakechangesintheves‐seldecksetupandworkinginteriorinordertoensureeffectivemonitoring.Thegeneralresponsesfromtheskippers and crewparticipating in theproject havebeen very positive. Both skippers and crew have been very cooperative and hardworking in getting the best possible quality of data. The experiences gained by thecooperation between the fishers and the scientist during this trial have shown thatthefishershavebeenmoreawareofwhereandwhenlargeamountofsmallcodhavebeen caught. If large quantities of small cod have been caught the fisher havechangedfishinggroundandeventriedtochangemeshsize.Furthermore,therehasbeen a positive reaction from the fishers and they have shown an increased aware‐ness of their fishing pattern. The idea giving the fishers an incentive by quota in‐creaseandmoreresponsibilityontheindividualfisherandthatallcatchesretainedanddiscardsarecountedontheirquotaisseenasawayforwardtowardsustainablefishing.Inadditionthecooperationandtalkswiththeparticipatingfishershaveshownarethat the fishers’s enthusiasm are not only related to the increased catch quotas butalsotoastrongwishtoensurecorrectbiologicaldataforresearchandadvice.Someofthefishershaveappreciatedtheperspectivesoffulldocumentationinrelationtomarketrequirementsandtheyhavepointedtothesystemsstrongadvantagescom‐paredtotheMSCcertificationscheme.Based on the results and experiences Electronic Monitoring systems can be imple‐mented as a new tool in the management of fisheries and enhance a developmenttowardamoresustainablefisheriesmanagement.
44
6REFERENCESMcElderry, H. 2008. At‐Sea Observing Using Video‐Based Electronic Monitoring.ReportpreparedfortheElectronicMonitoringWorkshopheldbyTheNorthPacificFisheryManagementCouncil,TheNationalMarineFisheriesServiceandTheNorthPacificResearchBoard,July2008.McElderry, H, R. Reidy, D. Pahti, 2006. A Pilot Study to Evaluate the Use of Elec‐tronicMonitoringonaBeringSeaGroundfishFactoryTrawler.Unpublishedreportprepared for the International Pacific Halibut Commission by Archipelago MarineResearchLtd.,VictoriaBC,Canada.McElderry,H.,A.Crumpacker,R.WrightandD.McCullough.2005.ElectronicMoni‐toring for the 2005 U. S. Shore‐based Pacific Hake Fishery‐‐A Pilot Study. Unpub‐lishedreportpreparedfortheNationalMarineFisheriesService,NorthwestFisheriesScience Center, National Oceanic & Atmospheric Administration, Department ofCommercebyArchipelagoMarineResearchLtd.,VictoriaBC,Canada.
7 ACKNOWLEDGEMENTThe Danish Ministry for Food, Agriculture and Fisheries, Danish Food IndustryAgencyfundedthisproject.We are grateful for the co‐operation and support of vessel owners, skippersandcrewsonboardtheDanishfishingvesselsHM555“Kingfisher”,S84Frk.Nielsen,H79“Tiki”andND399“Meonia”,HM423“FruMiddelboe”,S530“Yokotani”andND 176 “Søstrene” who carried EM equipment aboard their vessels, demonstratedinterest and significant willingness for providing feedback throughout the wholeprojectperiod.This project has been conducted without major difficulties thanks to ArchipelagoMarine Research Ldt. and the professionalism provided by Howard McElderry,MorganDyas,MariaJosePria,DaleMcCulloughandtheircolleagues.
SeveralDTUAquastaffparticipatedinthisprojectincluding:ReinhardtJensen,GertHolst, Peter Vingaard Larsen, Tommy Nielsen, Frederik Mathiassen, Lene Hansen,RikkeReisnerHansen,BoHansenandKirstenBirchHåkansson
45
8APPENDIXESAppendix1OverviewoftheEMSystemTheEMsystemsuppliedbyArchipelagooperatedon110ACvoltagetorecordimageryandsensordataduringeachfishingtrip.Thesoftwarewassettoau‐tomaticallyactivateimagerecordingbasedonpresetsensorindicators(e.g.netand longline retrieval). The EM system automatically restarted and resumedprogramfunctionsfollowingpowerinterruption.ThesystemcomponentsareschematicallypresentedinFigure1anddescribedinthefollowingsections.
Figure1.Schematicdiagramoftheelectronicmonitoringsystem,whichcanrecordvideodatafromuptofourcameraspervessel.
ControlBoxTheheartofArchipelago’selectronicmonitoringsystemwasametaltamper‐proof control box (approx. 30x20x19 cm.) that housed the digital data loggerandvideocomputercircuitry(Figure2).Thecontrolboxwasmountedinthewheelhouse and continuously powered with 24volts DCor 220 volts ACre‐spectively.
46
Screen
Control box
KeyboardFigure 2.An EM control box in a vessel’s wheelhouse.
VideoandDigitalDataStorageEachEMsystemhadapairof500GBcomputerharddrivesthatwereusedforvideodatacollection.Drivescouldbeswappedonthevesseltoallowreviewto take place on shore. Along with the video imagery, GPS and sensor datawerealsorecordedonthevideoharddrive.CCTVCamerasClosedcircuittelevision(CCTV)cameraswerechosenforinstallationonthesefishing vessels (Figure 3). The camera design has proven reliable in extremeenvironmentalconditionsforlong‐termdeploymentsonvesselsinotherfishe‐ries.Achoiceoflensesfromfisheyetotelephotoforoptimallyadjustthefieldofviewandimageresolutiononeachvessel.
Figure3.PhotographofaninstalledCCTVcameraonavesselencasedinacastaluminumarmoreddome.
47
The color cameras had 640 x 480 lines of resolution and low light capability(0.6 lux). The output signal was standard composite video delivered to thedigital video recorder by an RG59 coaxial cable. Twelve volt DC power wassupplied to the camera via paired 18 gauge wires packaged within a singlesheathwiththecoaxialcable.GPSReceiverAn independent Garmin 17N GPS receiver was installed with each EM sys‐tem. (Figure 4). The Garmin GPS receiver is a 12 channel parallel receiver,meaningitcantrackupto12GPSsatellitesatoncewhileusingfoursatellitesthat have the best spatial geometry to develop the highest quality positionalfix.
Figure4.GPSreceiverinstalledintheriggingofagillnetvesselawayfromotherantennaeandradars(left),andacloseupphotographofthemountedGPS.
The GPS time code delivered with the Garmin positional data is accurate towithin two seconds of the Universal Time Code (UTC). Archipelago’s EMsoftwareusestheGPStimetochronologicallystampdatarecordsandtoup‐date and correct the real time clock on the data‐logging computer. When 12volts DC is applied to the GPS it delivers a digital data stream to the data‐logging computer that provides an accurate time base as well as vessel posi‐tion,speed,headingandpositionalerror.TheEMsystemrecordsthelatitudeandlongitudeindegreesandminutestothreedecimalplacestherebyprovid‐ingatheoreticalresolutionof1.85meters(1minuteoflatitude=1,852meters).
48
Speedisrecordedinnauticalmilesperhour(knots)toonedecimalplaceandheadingtothenearestdegree.HydraulicPressureTransducerThesensorhasazeroto2500psirange,highenoughformostsmallvesselsys‐tems,anda15,000psiburstrating.Thesensorisfittedintoaquarterinchpipethreadgaugeportorteefittingonthepressuresideofthehaulercircuit.
Figure6Ahydraulicpressuresensorinstalledonthesupplylineofavesselformonitoringpoweratthewinchandtriggeringvideorecording.
Anincreaseinsystempressuresignalsthestartoffishingoperationssuchastrawlshotofanetset.Whenpressurereadingsexceedathresholdthecontrolbox software turns the digital video recorder on to initiate video data collec‐tion.DrumRotationSensorThe waterproof sensors were usually mounted in protected locations and areflectorwasmountedonarotationalcomponentofeachhauler.
49
Figure7Aninstalledphotoelectricdrumrotationsensorthattrackedvesselsettingandhaulingeventsinthesensordata,andfunctionedasasecondarytriggerforvideorecording.
50
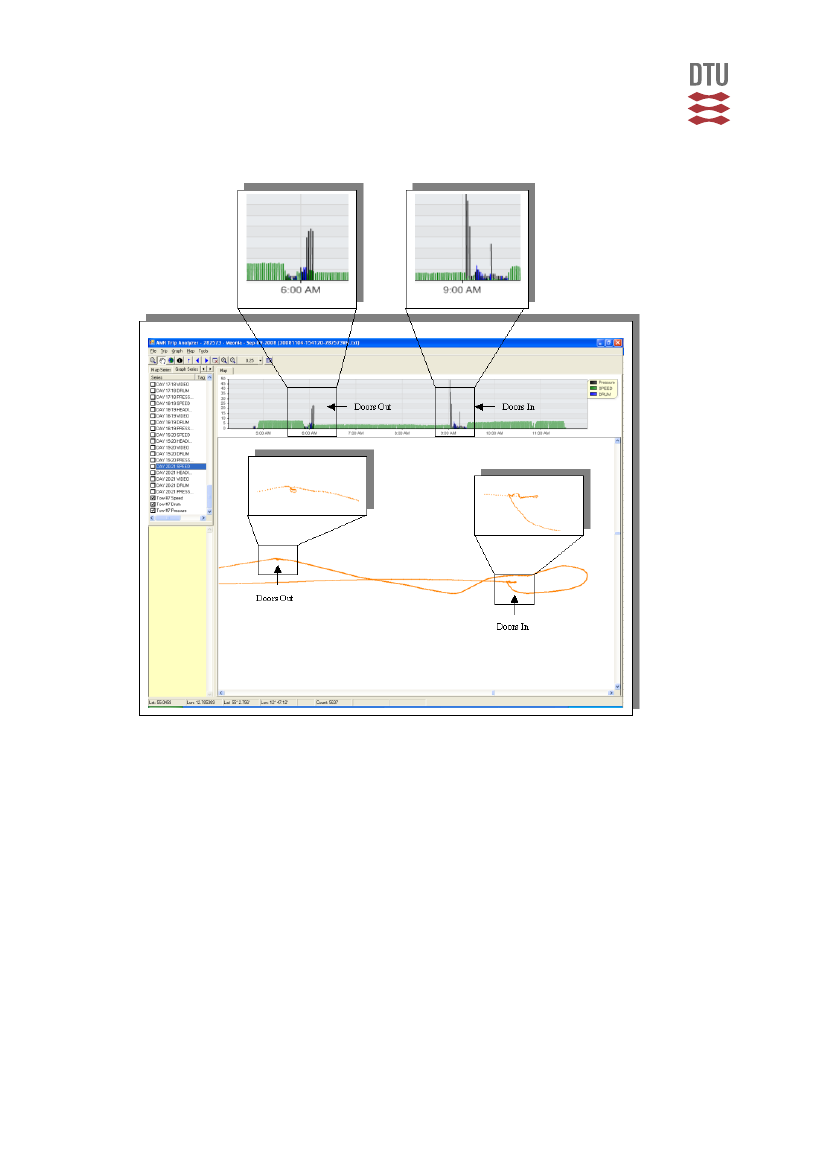
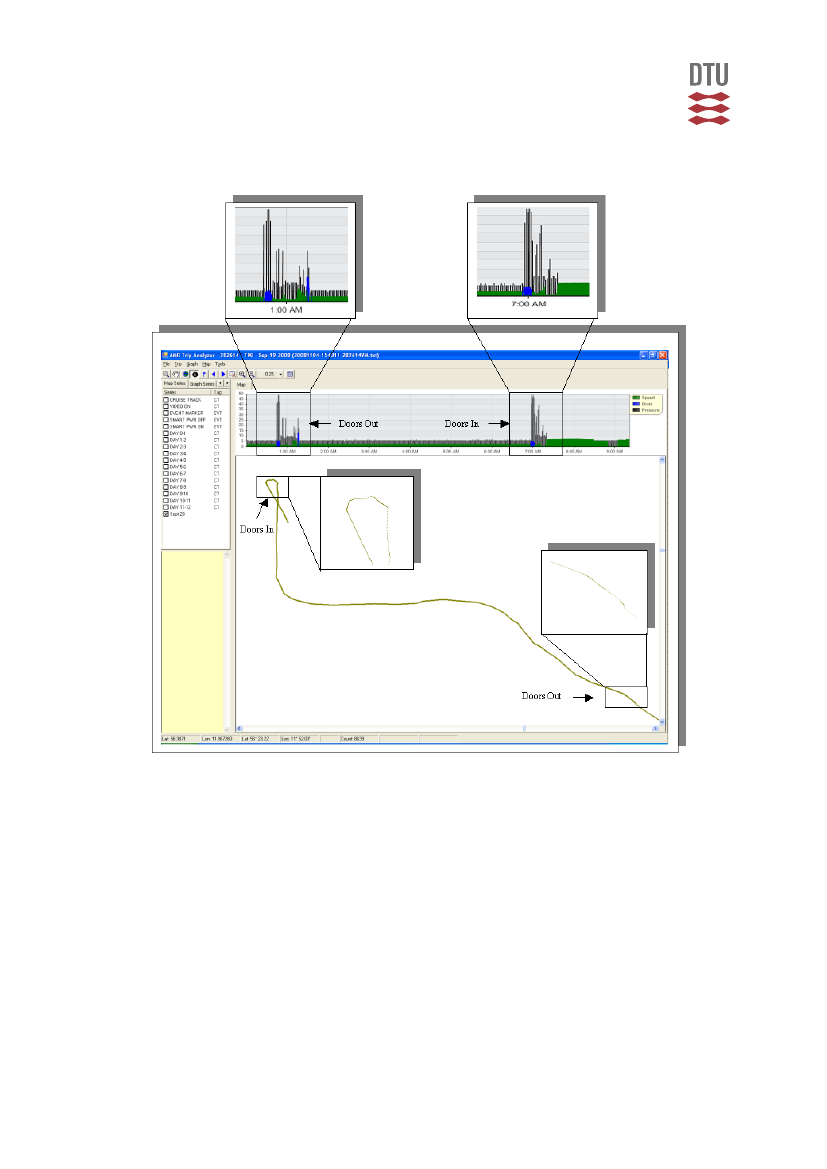
Appendix2Thefollowingareexamplesofhowfishingactivityhavebeendetectedbyusingsen‐sordata.
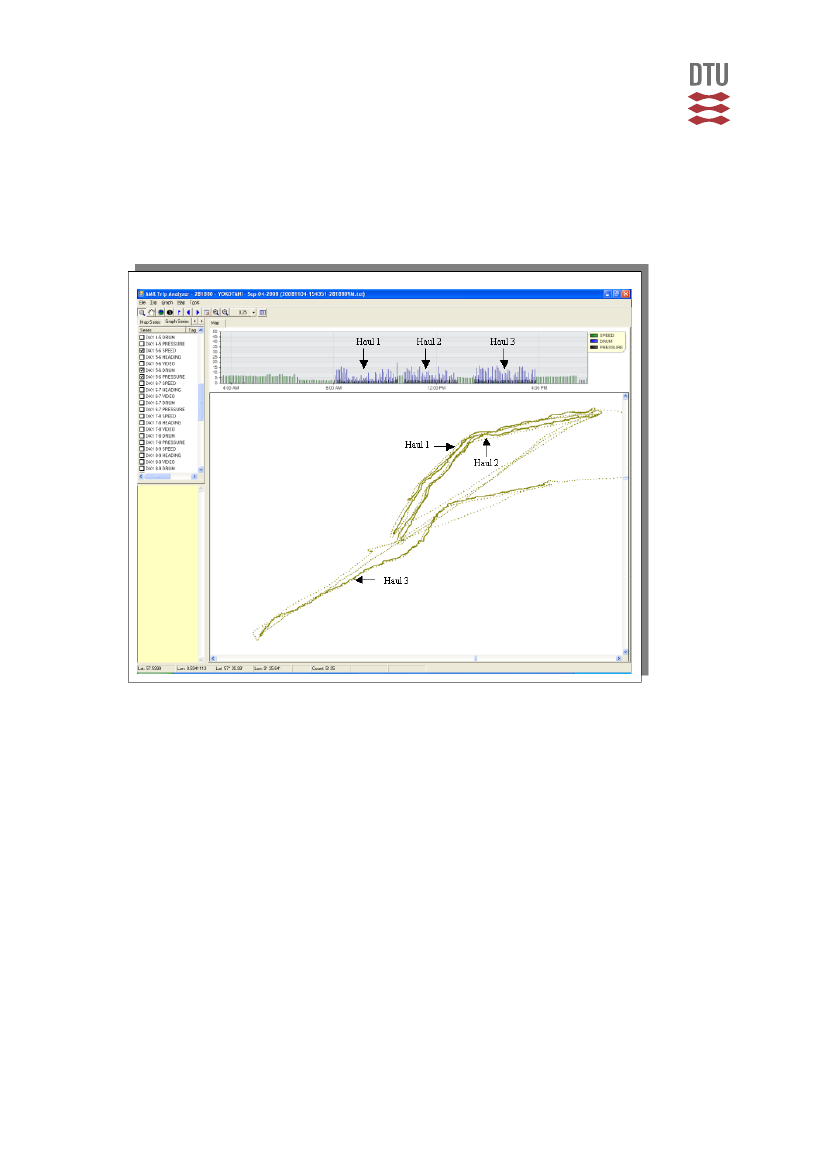
GearTypeGillnetvessel‐Asubmergednetthatwasanchoredateachend.Thenetwasallowedtosoakandthenhauledonboardandthecatchwasprocessed.Sets–NotdataenteredSometimestherewasashortspikeofpressureatthebeginningoftheset.Nodrumrotationduringevent.Nopressureduringevent.Averagespeedmaybe6.5to7.5knots.HaulSpeedgenerally<1.5knots.Inconsistentslowdrumrotationlessthat10.Continuouspressurebetween125and175psi.
51
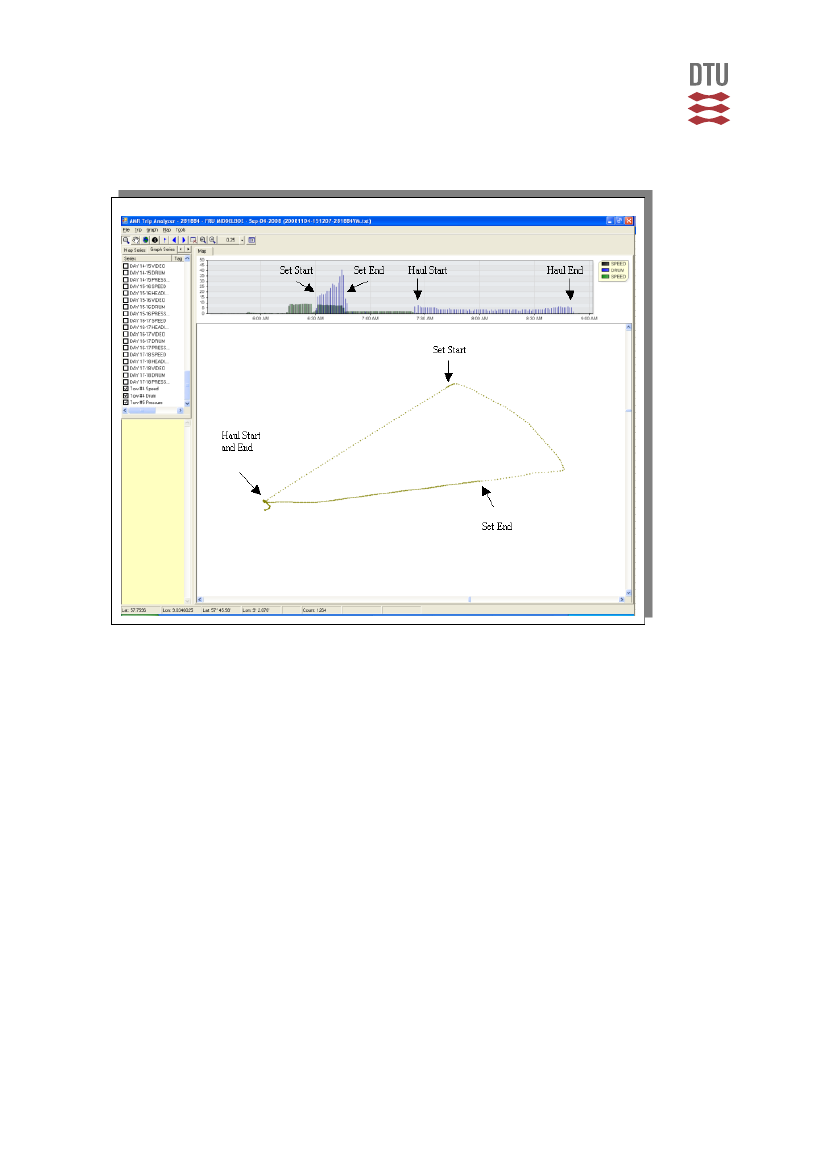
GearTypeDanishSeinevessel‐Aseinenetisdeployedbyfirstputtingoutonedragline,thenonenetwing,thebodyofthenet,onenetwingandfinallyaseconddragline.Thedraglinesarethenhauledfrombothendsatthesametime.SetsFromthepointoforigin,thevesselsteamsawayat8‐9knots.Whenthevesselcornerstheybegintodeploythenetwithdrumrotationof25‐35ataspeedofabout8knots.Midpointwasenteredwherethevesselturnsbacktowardsthepointoforiginandcontinuestosetnetforashortperiod.Attheendofthedrumrotationthevesselslowsto2‐3knotsandreturnstothepointoforigin.HaulAt origin the vessel is stationary while hauling the net with drum less than 10 andpressurearound200.
52
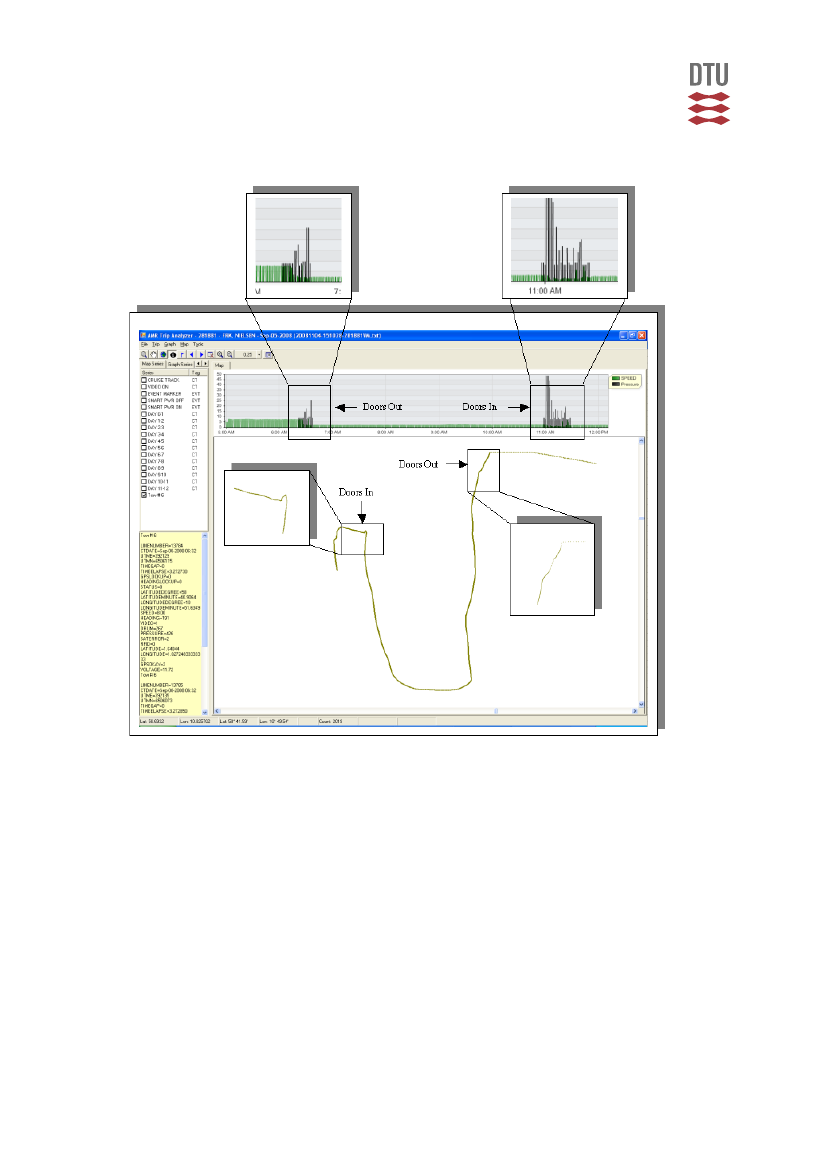
GearTypeTrawlvessel‐Anetisdeployedandtowedbehindvessel.Itishauledbackandthenetisbroughtonboardsothecatchcanbeprocessed.DoorsOutTherewasnodrumsensordataavailableandapproximately15minutesofpressure~400psiwithashortspikeupto~1200attheend.TowingAconstantspeedbetween2and3knotsforanaverageof5hoursDoorsInTherewasnodrumsensordataavailableandapproximately10minutesofpressure~2400psiwhicheventuallydropsdownto~400.Followedbyaperiodofverylowspeed(<1.5knots)whilecatchisprocessed
53
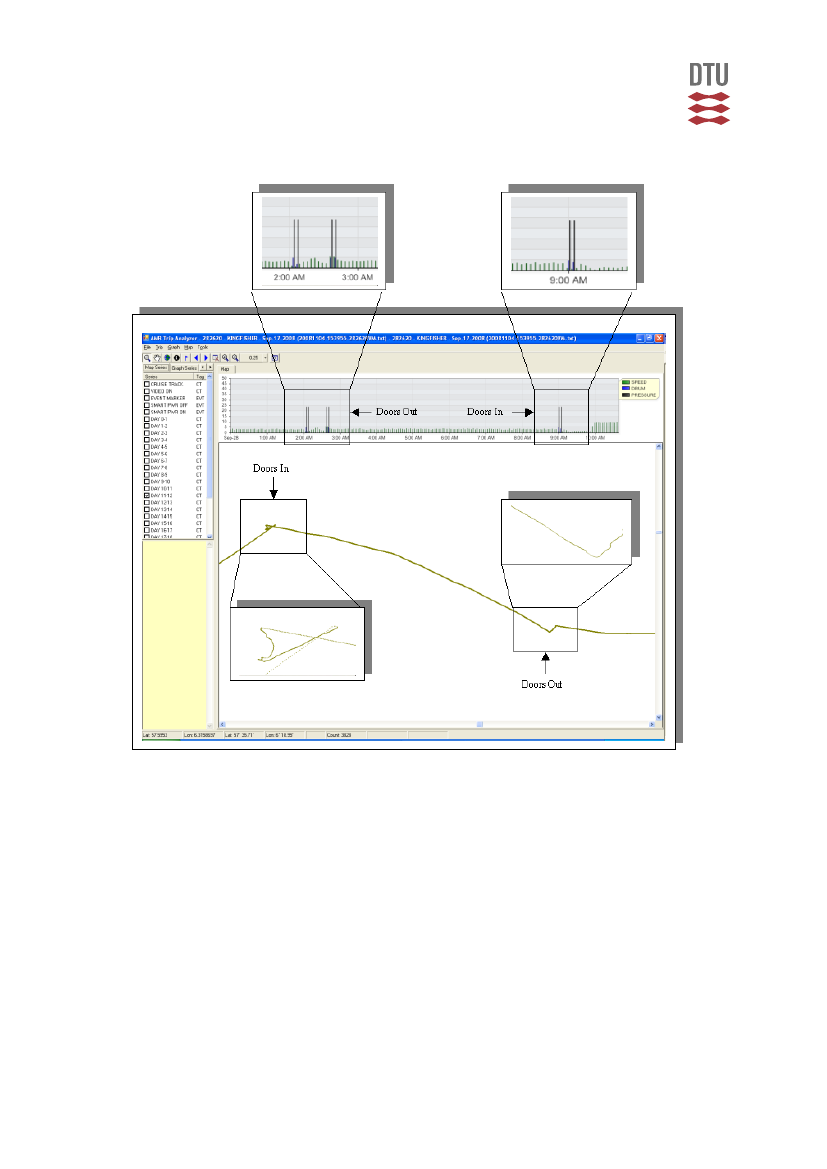
GearTypeTrawlvessel‐Anetisdeployedandtowedbehindvessel.Itishauledbackandthenetisbroughtonboardforcatchprocessing.DoorsOutShort(4minute)burstofdrum~6andpressure~1100psi.TowingAconstantspeedabout3.5knotsforanaverageof5to7hours.DoorsInShort(4minute)burstofdrum~6andpressure~1100psi.Vesselturnsbackslightlyattheendofeachtow.Followedbyaperiodofverylowspeed(<1.5knots)whilecatchisprocessed.
54
GearTypeTrawlvessel‐Anetisdeployedandtowedbehindvessel.Itishauledbackandthenetisbroughtonboardforcatchprocessing.DoorsOut3minutesofdrumaround6‐7followedby4minutesofpressuregreaterthan1000psi.Fewlineswithdrumrotationattheendofthepressure.TowingAconstantspeedabout4knotsforanaverageof4hours.DoorsIn4minutesofhighpressurefollowedbypressurewithdrumrotationlessthan6.Followedbyaperiodofverylowspeed(<1knot)whilecatchisprocessed
55
GearTypeTrawlvessel‐Anetisdeployedandtowedbehindvessel.Itishauledbackandthenetisbroughtonboardforcatchprocessing.DoorsOutShortburstofdrumbetween10and15withapressurespike~1300psifor2minutes.TowingAconstantspeedbetween2.5and3.0knotsforanaverageof5hours.
56